What You Should Know About Optical Satellite Imagery
Learn how optical satellite imagery works, from spectral bands to spatial resolution, plus practical applications across industries and access options through Geopera
The geospatial industry can feel overwhelming with terms like “multispectral” and “normalized indices,” but optical satellite technology has become one of humanity’s most valuable assets for understanding our planet. Whether you’re monitoring crop health, tracking urban development, or managing mining operations, optical satellite imagery provides the critical insights you need.
At Geopera, we’ve made accessing and understanding this technology straightforward. Through partnerships with leading providers like MAXAR, 21AT, and CGSTL, we deliver high-quality optical imagery processed exactly how you need it.
What is Optical Satellite Imagery?
Optical satellites are passive sensors that capture reflected sunlight from Earth’s surface, much like a camera in space. Unlike radar satellites that emit their own signals, optical sensors depend on the sun’s illumination, making them energy-efficient and cost-effective for many applications.
These satellites operate primarily in the visible and near-visible portions of the electromagnetic spectrum, capturing wavelengths our eyes can see—and some they can’t. The result is imagery that’s intuitive to interpret while containing rich data layers for advanced analysis.
Key Advantages
Lower operational costs compared to active sensor systems like radar
Natural color imaging that’s immediately understandable
High spatial resolution capabilities reaching 30cm per pixel
Multiple spectral bands for specialized analysis beyond visible light
Important Limitations
Cloud cover can obstruct ground visibility
Daylight dependency limits nighttime imaging capabilities
Atmospheric conditions affect image quality
Seasonal variations in sun angle impact shadow length and illumination
For consistent monitoring regardless of weather or time, consider complementing optical data with radar imagery. But for most commercial applications, optical satellites provide the clearest, most cost-effective solution.
Understanding Spatial Resolution: The Clarity Factor
Spatial resolution determines how much detail you can see in satellite imagery. It’s measured as Ground Sample Distance (GSD)—the real-world size each pixel represents.
Resolution Categories
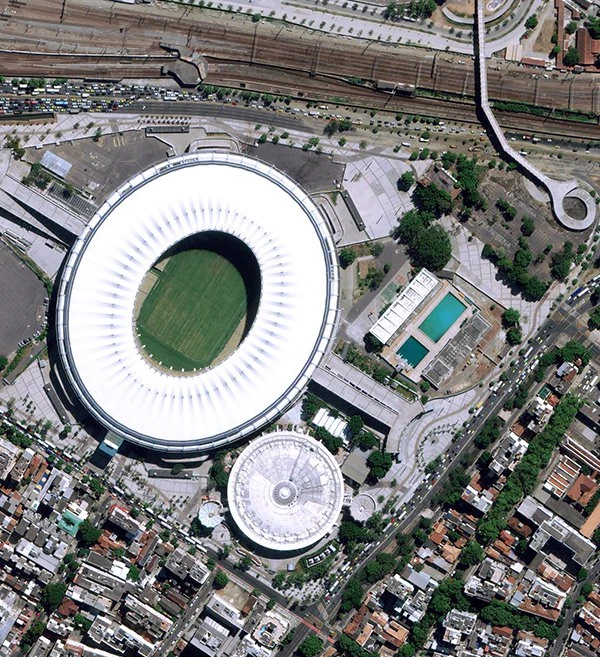
Very High Resolution (0.3-1m): Individual objects like cars, trees, and building features are distinguishable. Essential for detailed infrastructure monitoring and precision agriculture.
High Resolution (1-5m): Buildings, roads, and field boundaries are clear. Ideal for urban planning and agricultural field management.
Medium Resolution (5-30m): Land cover patterns and large infrastructure visible. Perfect for regional monitoring and environmental studies.
Low Resolution (>30m): Continental and global patterns observable. Used for climate studies and large-scale environmental monitoring.
Geopera’s Available Resolutions
Through our Pera Portal, you can access:
- Beijing-3: 0.5m panchromatic, 2m multispectral
- Jilin-1 Constellation: 0.75m panchromatic, 3m multispectral
- SuperView: 0.5m panchromatic, 2m multispectral
- MAXAR WorldView: 0.3m panchromatic, 1.2m multispectral
- Sentinel-2: 10m multispectral (free data)
Remember: higher resolution means smaller coverage area per image. Choose based on your project’s balance of detail versus coverage needs.
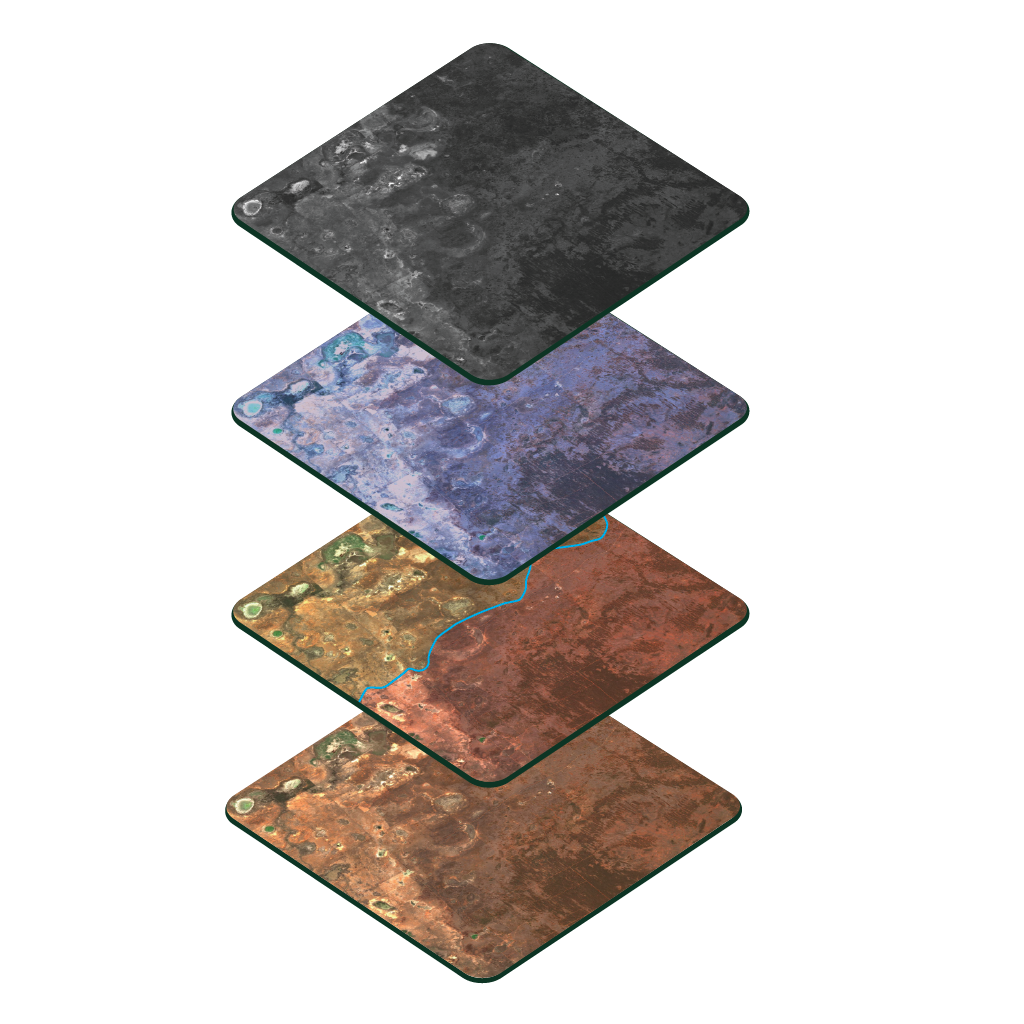
The Electromagnetic Spectrum and Spectral Bands
Optical satellites don’t just capture what we see—they detect wavelengths invisible to human eyes, revealing hidden information about Earth’s surface.
Understanding Spectral Bands
Each spectral band captures a specific range of electromagnetic wavelengths, and different materials reflect these wavelengths uniquely. This “spectral signature” allows us to identify and analyze surface features beyond what’s visible in regular photographs.
Essential Spectral Bands
Coastal/Deep Blue (400-450nm) Penetrates water to reveal bathymetry and detect phytoplankton. Critical for coastal monitoring and water quality assessment.
Blue (450-510nm) Sensitive to atmospheric conditions and water bodies. Used for discriminating soil from vegetation and detecting industrial pollution.
Green (510-580nm) Peak reflectance for healthy vegetation. Essential for assessing plant vigor and differentiating plant species.
Red (630-690nm) Absorbed by chlorophyll in healthy plants. Combined with NIR for vegetation indices like NDVI.
Red Edge (690-730nm) Captures the transition zone where vegetation reflectance dramatically increases. Highly sensitive to plant stress and chlorophyll content—often detecting issues before visible symptoms appear.
Near-Infrared/NIR (760-900nm) Strongly reflected by healthy vegetation. The foundation for most vegetation health assessments and moisture detection.
Panchromatic (450-800nm) Combines all visible wavelengths into high-resolution grayscale. Provides the sharpest detail but without color information.
Multispectral vs Panchromatic: Making the Right Choice
Multispectral imagery provides multiple bands of spectral information at moderate resolution—essential for analysis requiring spectral indices or false-color composites.
Panchromatic imagery sacrifices color for superior spatial detail—ideal when you need to identify small features or precise boundaries.
Pansharpening combines both: fusing high-resolution panchromatic with multispectral bands creates sharp, full-color imagery. At Geopera, we offer pansharpened products that deliver both detail and spectral richness. Learn more about our processing capabilities.
Real-World Applications
Optical satellite imagery transforms how industries operate, providing actionable insights that were previously impossible or prohibitively expensive to obtain.
Agriculture & Crop Monitoring
Modern farming relies on satellite-derived vegetation indices to optimize operations:
- Crop health assessment using NDVI identifies stress zones before visible symptoms
- Irrigation management through soil moisture analysis reduces water waste
- Yield prediction helps with harvest planning and market positioning
- Pest and disease detection enables targeted treatment instead of blanket applications
Explore our agriculture solutions to see how Australian farmers are increasing yields while reducing inputs.
Mining & Resource Management
The mining sector leverages optical imagery throughout the project lifecycle:
- Exploration using multispectral analysis to identify mineral signatures
- Site monitoring tracks excavation progress and equipment deployment
- Environmental compliance documents vegetation clearing and rehabilitation
- Infrastructure planning optimizes haul road design and processing facility placement
Our mining industry solutions help companies maintain operational efficiency while meeting environmental obligations.
Environmental Monitoring
Conservation efforts depend on consistent, accurate Earth observation:
- Deforestation tracking with change detection algorithms
- Water quality monitoring using spectral signatures of algae and sediments
- Coastal erosion measurement through time-series analysis
- Fire scar mapping for post-disaster assessment and recovery planning
View our environmental monitoring capabilities to understand ecosystem changes at any scale.
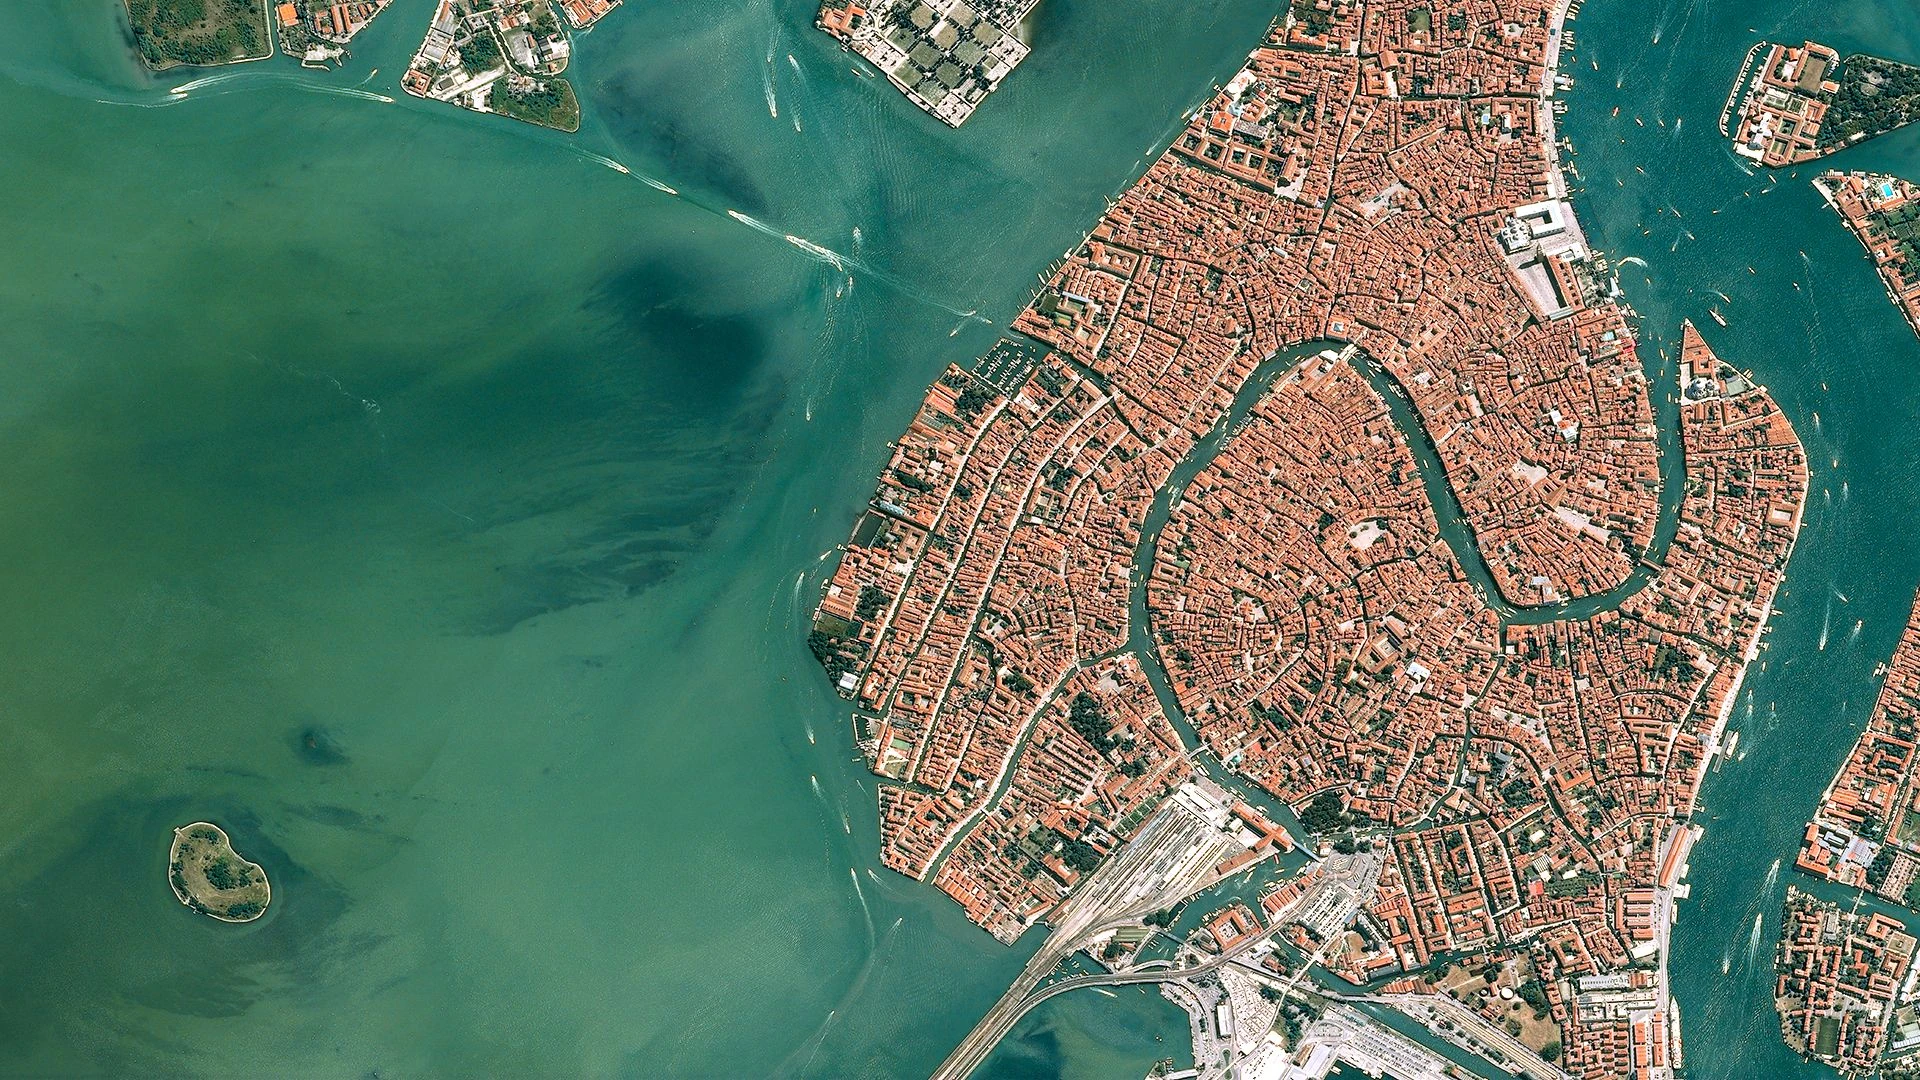
Urban Planning & Infrastructure
Cities use optical imagery for smarter development:
- Urban sprawl analysis guides sustainable growth policies
- Green space monitoring ensures adequate urban vegetation
- Construction progress tracking keeps projects on schedule
- Traffic pattern analysis from high-frequency imaging
Discover infrastructure monitoring solutions that help build better cities.
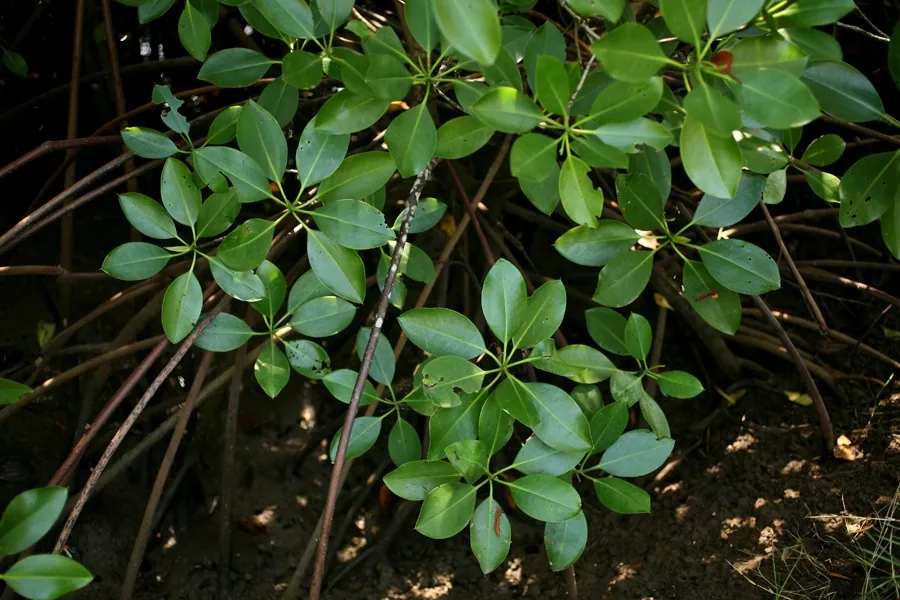
Forestry & Vegetation Management
Forest managers protect valuable resources with satellite insights:
- Tree species classification using multispectral signatures
- Disease and pest outbreak detection through red edge analysis
- Biomass estimation for carbon credit calculations
- Fire risk assessment combining vegetation indices with weather data
Our forestry solutions support sustainable forest management across Australia’s diverse ecosystems.
How to Access Optical Satellite Imagery with Geopera
Getting the satellite data you need shouldn’t be complicated. Through our Pera Portal, we’ve streamlined the entire process from discovery to delivery.
Archive vs. Tasking
Archive Imagery: Previously captured data available for immediate download. Cost-effective for historical analysis or when recent imagery exists. Most areas have archive coverage within the past 12 months.
Tasking Orders: Request new captures over your area of interest. Essential for time-critical projects or specific acquisition parameters. Typical delivery within 7-14 days, weather permitting.
Our Satellite Partners
We’ve partnered with the world’s leading optical satellite operators:
- 21AT: Beijing-3 satellite with 0.5m resolution
- CGSTL: Jilin-1 constellation for frequent revisits
- MAXAR: Industry-leading 30cm resolution
- Wyvern: Hyperspectral imaging for advanced analysis
- Sentinel Hub: Free Sentinel-2 data with 10m resolution
Processing Options
All Geopera imagery comes fully processed and analysis-ready:
- Orthorectification removes geometric distortions
- Atmospheric correction ensures accurate spectral values
- Pansharpening combines detail with color
- Custom band combinations for specific applications
- Vegetation indices calculated and delivered
Getting Started
- Define your requirements: Area size, resolution needs, temporal requirements
- Search available data: Use our catalog to find archive imagery or plan a tasking
- Select processing level: Choose from our standard or custom processing options
- Place your order: Simple checkout with transparent pricing
- Access your data: Download via portal or integrate through our API
Start exploring available imagery or contact our team for guidance on your specific requirements.
Choosing the Right Optical Imagery
Selecting optimal imagery involves balancing multiple factors:
Resolution Requirements
Infrastructure projects: 0.3-1m for detailed engineering Agricultural monitoring: 1-5m for field-level analysis Regional studies: 10-30m for cost-effective coverage Continental mapping: 30m+ for large-scale patterns
Temporal Considerations
Change detection: Consistent acquisition dates and sun angles Crop monitoring: Weekly to monthly during growing season Construction tracking: Monthly or quarterly updates Emergency response: Daily tasking if available
Spectral Requirements
Visual interpretation: RGB natural color Vegetation analysis: Red, NIR, and Red Edge bands Water studies: Blue and coastal bands Mineral exploration: SWIR and thermal bands
Budget Optimization
- Start with free Sentinel-2 data for regional assessments
- Use medium resolution for initial surveys
- Reserve high resolution for detailed areas of interest
- Consider archive imagery before requesting new tasking
Advanced Techniques and Analysis
Modern optical satellite analysis extends far beyond visual interpretation:
Spectral Indices
Calculate specialized indices from band combinations:
- NDVI (Normalized Difference Vegetation Index): Vegetation health
- NDWI (Normalized Difference Water Index): Water body detection
- NDSI (Normalized Difference Soil Index): Bare soil mapping
- Custom indices: Tailored to specific materials or conditions
Explore our vegetation indices documentation for calculation methods and applications.
Time Series Analysis
Track changes over time with multi-temporal imagery:
- Seasonal vegetation patterns
- Urban growth trajectories
- Erosion and deposition rates
- Post-disaster recovery monitoring
Machine Learning Integration
Apply AI to extract insights at scale:
- Automated feature detection
- Land cover classification
- Change detection algorithms
- Predictive modeling
The Future of Optical Satellite Technology
The optical satellite industry is evolving rapidly, with innovations that will transform Earth observation:
Emerging Capabilities
Hyperspectral imaging with hundreds of narrow bands for material identification
Video from space capturing dynamic events in real-time
30cm resolution becoming commercially available
Daily global coverage through large constellations
On-board AI processing for immediate insight delivery
Geopera’s Technology Roadmap
We’re continuously expanding our capabilities:
- Adding new satellite partnerships for better coverage
- Developing advanced processing algorithms
- Integrating AI-powered analysis tools
- Streamlining data delivery through API enhancements
Stay updated with our latest capabilities by contacting us.
Common Questions About Optical Imagery
How does cloud cover affect imagery?
Clouds obstruct the satellite’s view of the ground. We provide cloud coverage percentages for all archive imagery and can schedule multiple tasking attempts to capture cloud-free data.
What’s the difference between optical and radar satellites?
Optical satellites use reflected sunlight (passive), while radar satellites emit their own signals (active). Optical provides clearer, more intuitive imagery but can’t penetrate clouds. Radar works in all weather but requires more processing for interpretation.
How current is archive imagery?
Most populated areas have archive imagery within 6-12 months. High-interest areas may have weekly or monthly coverage. Search our catalog for specific availability over your area of interest.
Can I request specific acquisition angles?
Yes, for tasking orders you can specify off-nadir angles, sun elevation requirements, and other parameters. This is particularly useful for avoiding shadows in mountainous terrain or capturing building facades.
Start Your Optical Satellite Project Today
Optical satellite imagery has evolved from a specialized tool to an essential business asset. Whether you’re optimizing agricultural operations, monitoring infrastructure, or protecting natural resources, the insights are there—waiting to be discovered.
At Geopera, we’ve removed the complexity from accessing this powerful technology. Our platform combines world-class satellite data with intuitive tools and expert support, ensuring you get exactly what you need.
Ready to see what optical satellites can reveal about your area of interest?
Browse available imagery in our Pera Portal
Contact us for a guided tour of our capabilities
Contact our experts to discuss your specific requirements
Contact us to explore image quality and processing options
The sky’s no longer the limit—it’s your new vantage point for understanding our changing world.
Related Articles
What is Satellite Imagery?
A comprehensive guide to satellite imagery technology, its various types, and commercial applications.
Understanding Remote Sensing Vegetation Indices
Learn about NDVI, EVI, SAVI and other key vegetation indices used in satellite imagery analysis.
Best Satellite Imagery for Every Application
Complete guide to selecting the optimal satellite imagery for your specific application needs.