
Environmental
Improve environmental outcomes with satellite data
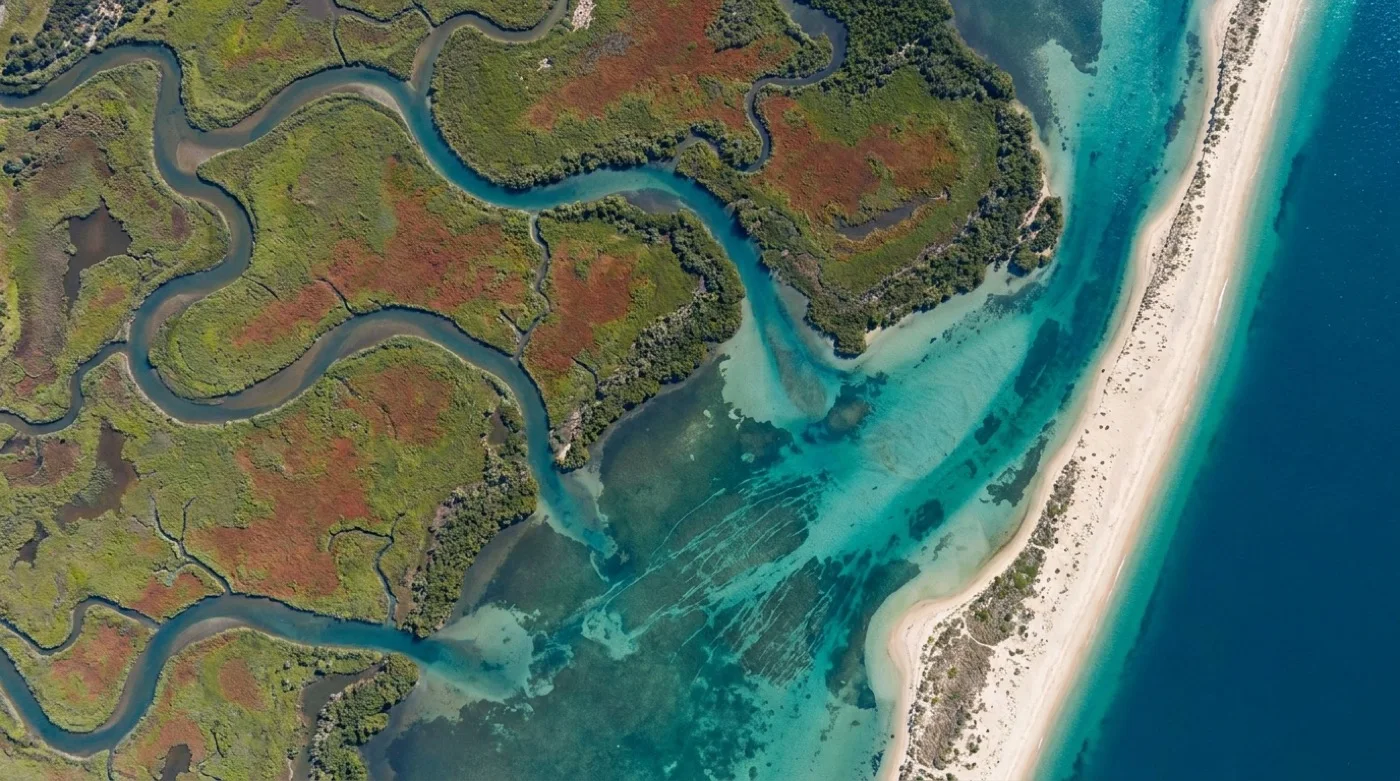
High-resolution optical, hyperspectral, and SWIR imagery for carbon project planning, credit verification, and restoration tracking.
Capabilities
Carbon stock assessment
Use satellite imagery to estimate biomass and carbon sequestration potential across landscapes

Environmental change monitoring
Track ecosystem changes, restoration progress, and land use changes over time

Project verification and reporting
Verify carbon credits with consistent, QC-checked satellite data
SITE ASSESSMENT
Map carbon potential before investing in a project
Map carbon sinks and biodiversity hotspots with multi-spectral satellite imagery. Quantify biomass and baseline conditions before committing to a site.
Order imagery
ECOLOGICAL ASSESSMENT
Document ecosystem health with hyperspectral data
Hyperspectral imaging separates plant species and shows vegetation stress. Map habitats and track ecological change over time.
Order hyperspectral imagery
COMPLIANCE & REPORTING
Strengthen carbon credit verification with consistent data
Build credibility with regulators and buyers using satellite-verified carbon sequestration data. Reduce site visits and create consistent documentation with regular monitoring and change detection analytics.
Talk about verification
PROJECT TRACKING
Document restoration success with time-series analysis
Track revegetation and canopy cover with repeat satellite passes. Produce dated before-and-after imagery for stakeholder reports.
Talk about monitoringSee Legato-processed imagery over your own AOI
Talk to our team about the imagery your project needs.