Satellite Change Detection: How to Track Change Over Time
Satellite change detection compares imagery over time to map what changed. How it works, the data consistency it needs, and which satellites to use.
Summary
- Satellite change detection compares two or more images of the same place, captured at different times, to map what actually changed on the ground: new clearings, growing mines, urban sprawl, flooded land, harvested fields.
- Consistency matters more than resolution. The same patch of ground imaged at a different sun angle, different season, or through different haze can look “changed” when nothing happened. Good change detection is mostly about removing those false alarms.
- Free archives carry the historical baseline. Sentinel-2 (10m, since 2015) and Landsat (30m, since 1972) give you decades of consistent, pre-corrected imagery, the backbone of most time-series work.
- High-resolution tasking catches what 10m misses. For change you need to see at object level (a single new building, an encroaching pit wall, an illegal track), sub-metre satellites like Beijing-3 (0.5m), Jilin-1 and SuperView are the tools.
- Regulation is now driving demand. The EU Deforestation Regulation (EUDR) effectively forces companies to prove a plot of land wasn’t cleared after December 2020, and satellite change detection is how that proof gets made.
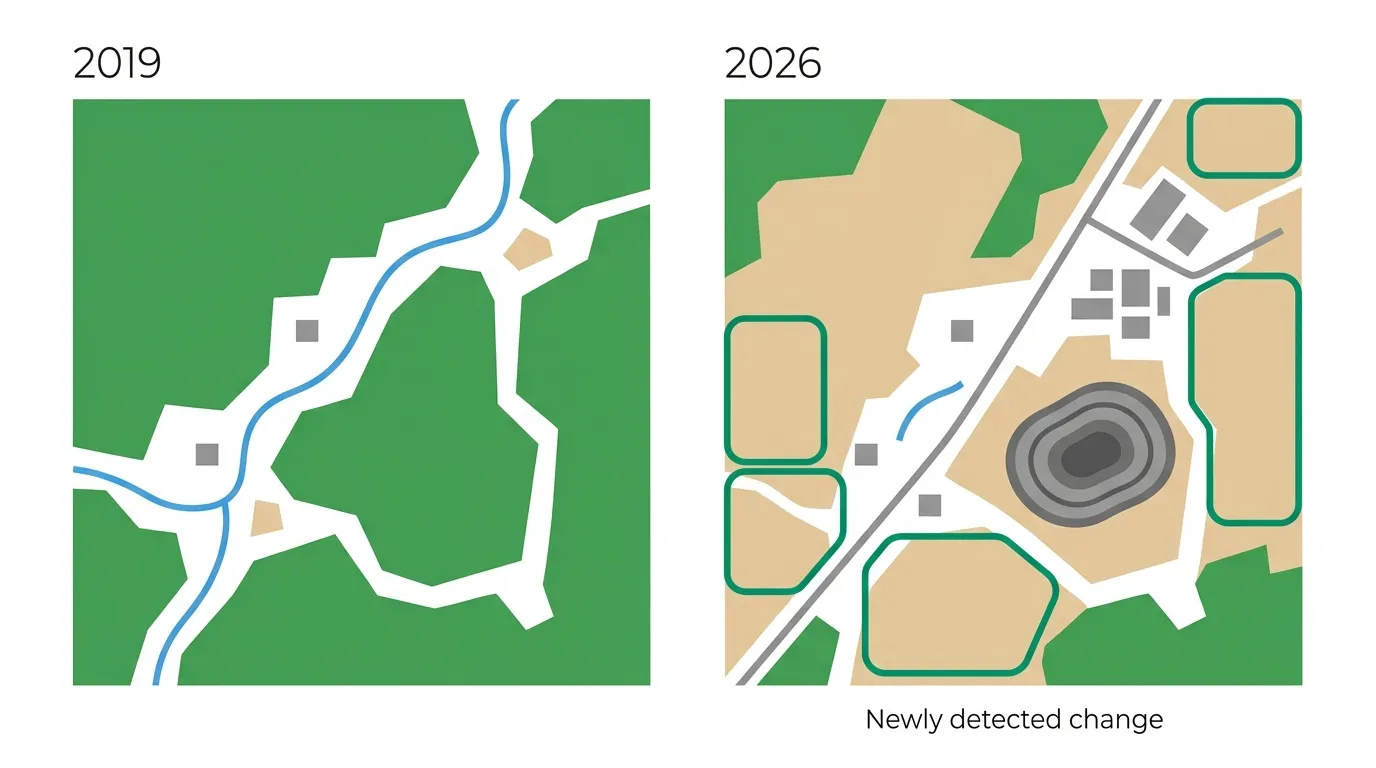
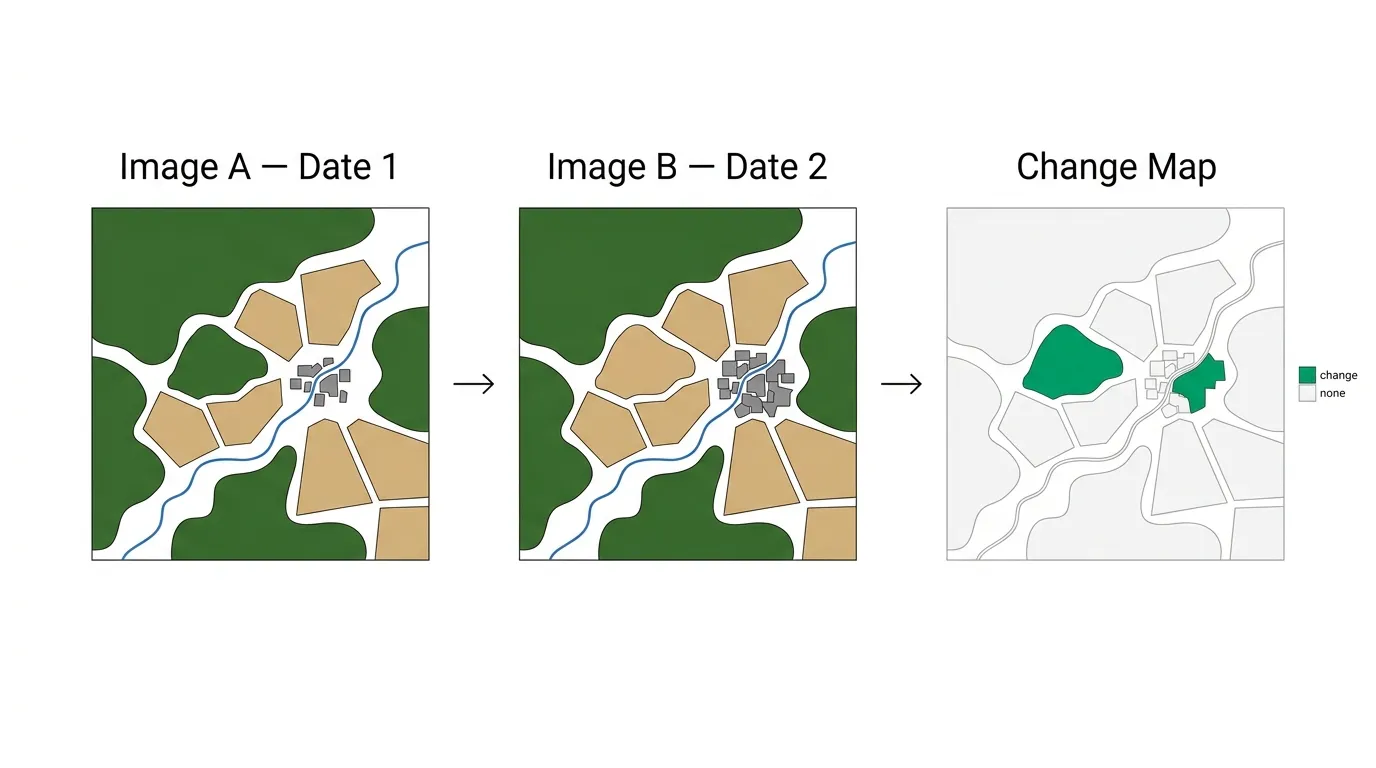
Play a quick game. Look at the two panels above. Same patch of ground, two dates years apart. Now find everything that’s different.
You spotted the mine, obviously. Probably the cleared land where forest used to be. Did you catch the new road slicing across? The way the river thinned out? The town that doubled in size?
That game, spot the difference but for the whole planet, at scale, without a human squinting at every frame, is satellite change detection. It’s one of the most useful things you can do with satellite imagery, and also one of the easiest to get wrong. Most of the difficulty isn’t finding change. It’s telling real change apart from the imagery just looking a bit different because the light moved.
What Satellite Change Detection Actually Is
Change detection in remote sensing is the process of comparing imagery of the same location from two or more dates to identify and measure what has changed between them. That’s the whole idea. You take an image from Date 1, an image from Date 2, and you ask the data a simple question: where are these two different, and by how much?
The output is usually a change map: a layer that’s blank where nothing moved and lit up where something did. Forest that became bare earth. Empty lots that became warehouses. A reservoir that dropped two metres. The map turns “stuff happened somewhere out there” into “here, exactly here, this much, between these dates.”
People reach for it whenever the question is about change over time rather than a single snapshot. How fast is this city spreading. Is that mine staying inside its permit boundary. How much forest did we lose this quarter. Did the flood reach the town or stop short. None of those can be answered by one image. They all fall out of comparing two.
How Change Detection Works, Step by Step
Under the hood there are dozens of algorithms, ranging from “subtract one image from the other” to deep-learning models with names that sound like they belong in a particle physics paper. But the workflow underneath almost all of them is the same four moves.
1. Pick two dates of the same place. Sounds trivial. It isn’t, and we’ll get to why in a minute. The two images need to cover the same ground, ideally from the same sensor, ideally captured at a similar time of year.
2. Line them up exactly. This is called co-registration. If the two images are even one pixel out of alignment, the algorithm “sees” the edges of every road, field and rooftop as change, because the road in Image A sits where the grass in Image B is. Sub-pixel registration is non-negotiable. Get this wrong and your change map is just a tracing of every boundary in the scene.
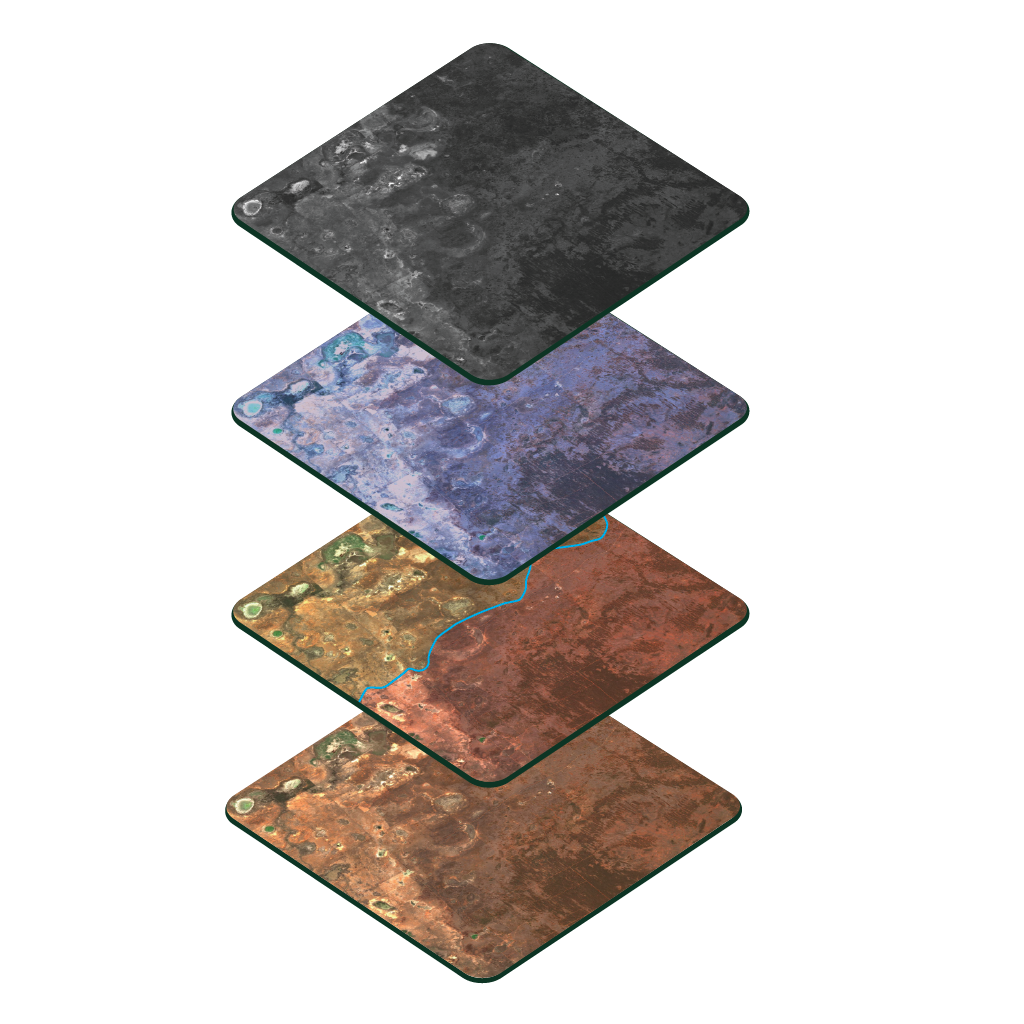
3. Compare. Here’s where the methods split. The simplest is image differencing: subtract the pixel values of Date 1 from Date 2 and look at what’s left. Bigger difference, bigger change. A step up is spectral index differencing. Instead of raw brightness, you compare an index like NDVI, which tracks vegetation, so you’re measuring “how much did the greenness change” rather than “how much did the brightness change.” Then there’s post-classification comparison, where you classify each image into land-cover types (forest, water, built-up) and compare the labels. And at the top end, deep-learning models trained to recognise change directly. This is where AI and machine learning have genuinely moved the field forward.
4. Keep the real change, drop the noise. The raw comparison flags far more “change” than actually happened. Thresholding, filtering, and a bit of human judgement separate the genuine signal (a new clearing) from the junk, like a slightly brighter field because the sun was lower that day.
The Thing Nobody Tells You: Consistency Beats Resolution
Here’s the part that trips up almost everyone who tries change detection for the first time.
You’d assume the sharpest possible imagery gives the best results. It doesn’t, necessarily. Two 30cm images that were captured under wildly different conditions will produce a worse change map than two 10m images that match each other. For change detection, consistency between your two dates matters more than the resolution of either one.
Think about photographing the same room on two different days to see if anything moved. If you shoot one photo at noon and one at dusk, half the room “changes”: the shadows shifted, the colours warmed, the corners went dark. Nothing actually moved. You created phantom change purely by changing the lighting. Satellites have the same problem, except the lighting is the sun angle, the haze is the atmosphere, and the seasons swap the vegetation in and out underneath you.
So good change detection obsesses over matching the two dates:
- Same sensor. Two images from the same satellite are directly comparable. Mixing a 50cm image from one provider with a 30cm image from another means matching their spectral bands, their calibration, and their geometry first.
- Similar time of day and sun angle. Sun-synchronous satellites help here by crossing the equator at roughly the same local time each pass, so the lighting stays comparable.
- Near-anniversary dates. Comparing June to June beats comparing June to December. A field looks completely different across seasons even when the land use never changed. Imaging close to the same date each year cancels most of that out.
- Atmospheric correction on both. This is the big one. Raw imagery includes whatever haze, dust and water vapour sat between the satellite and the ground that day. Two clear days can still produce surface brightness that differs by tens of percent, purely from the atmosphere. Convert both images to surface reflectance first and that phantom change disappears. We went deep on this in our guide to atmospheric correction. It’s the single most common reason time-series analysis goes sideways.
Get the consistency right and even modest imagery gives you a clean change map. Get it wrong and the best imagery money can buy lights up like a fireworks display over change that never happened.
What You’re Actually Detecting
Change detection isn’t one use case. It’s a method that bends to whatever you point it at. A few of the big ones, because the specifics matter:
Deforestation monitoring. This is the fastest-growing reason people ask us about change detection right now, largely because of the EU Deforestation Regulation, which pushes companies to prove the land their commodities came from wasn’t cleared after a fixed baseline date. Underneath the paperwork it’s pure change detection: compare the baseline against now, plot by plot. We walk through the regulation itself, the 2026 deadlines and exactly what counts as proof in our guide to EUDR compliance and satellite imagery.
Mining site monitoring. Open-pit mines change shape constantly, and mining site change detection answers questions regulators and operators both care about: is the disturbance footprint staying inside the permitted boundary, how fast are tailings dams growing, is there illegal artisanal mining creeping in at the edges. We dig into this in our piece on satellite imagery for mining.
Urban growth. Cities expand at the fringes, building by building. Urban change detection tracks new construction, informal settlements, infrastructure rollout and land-use shifts, which matters to planning authorities, infrastructure operators, and anyone valuing land near a growing edge.
Agriculture and vegetation. Harvest timing, crop rotation, land clearing, irrigation expansion, the slow creep of drought stress across a region. Most of this runs on index-based change (NDVI and friends) rather than raw imagery, and ties into broader vegetation management with satellite data.
Disaster response. Before-and-after is the purest form of change detection. Flood extent, fire scars, building collapse after an earthquake, landslide runout. The “after” image gets compared against the most recent clean “before” image, and the difference is the damage map that crews work from.
Which Satellites to Use for Change Detection
The right satellite depends entirely on what kind of change you’re chasing and how often you need to see it. There’s no single best answer. There’s a baseline layer and a detail layer, and most serious monitoring uses both.
The free archives are where almost everyone starts, and for good reason. They’re consistent, pre-corrected, and they go back decades:
- Landsat: 30m resolution, but an archive stretching to 1972. Nothing else gives you a fifty-year baseline. If your question is “what did this place look like in 1990,” Landsat is often the only answer.
- Sentinel-2: 10m resolution, free, with a revisit of about five days and consistent processing since 2015. This is the workhorse of operational change monitoring. Plenty of detail for land cover, agriculture, deforestation and water, and frequent enough to actually track change as it happens rather than after the fact.
We keep a running list of where to pull these in our guide to free sources of satellite data.
Where the free archives run out is object-level change. At 10m, a pixel is the size of a generous living room: fine for “the forest shrank,” useless for “someone built a shed and cut a new access track.” For that you need high-resolution commercial imagery, and because change detection needs two matched dates, you usually want to task a fresh capture to pair against an archive image or an earlier task.
| Source | Resolution | Revisit | Archive depth | Best for change detection |
|---|---|---|---|---|
| Landsat | 30m | ~16 days | 1972 → now | Long-baseline land-cover trends, decade-scale comparisons |
| Sentinel-2 | 10m | ~5 days | 2015 → now | Operational monitoring: deforestation, agriculture, water, broad land cover |
| Beijing-3 (21AT) | 0.3–0.5m | Tasking | Archive + tasking | Object-level urban, mining boundary, infrastructure change |
| Jilin-1 (CGSTL) | 0.5–0.75m | Tasking | Archive + tasking | High-frequency high-res monitoring, large-area tasking |
| SuperView (SpaceWill) | 0.5m | Tasking | Archive + tasking | Detailed site monitoring, encroachment detection |
A common pattern: run Sentinel-2 continuously to flag where something is changing across a wide area, then task a sub-metre satellite to zoom in on the flagged spots and see what actually changed. Cheap wide net, sharp targeted follow-up. You don’t pay for 50cm imagery across a whole province. You pay for it over the three places that lit up.
Getting Change-Ready Imagery Without the Headache
Here’s where most change detection projects stall. The method is well understood. The free data is right there. And then you spend three weeks fighting co-registration, hunting down matching dates, and discovering your two “clear” images were corrected differently and disagree by 20%.
That alignment-and-consistency work is exactly what we handle. Every order through Geopera is orthorectified, atmospherically corrected, and processed to a consistent standard before it reaches you, included in the base price, not bolted on as an extra. That means two images you order for a comparison actually match, instead of needing a fortnight of cleanup before you can trust the difference between them. Most providers ship raw or semi-processed data and leave that part to you.
Through one platform you can pull archive imagery for your baseline and task new captures for the current date, across multiple satellite operators (Beijing-3, Jilin-1, SuperView and others) without juggling separate accounts, formats and processing pipelines. Free Sentinel-2 and Landsat for the wide-area baseline, commercial sub-metre for the detail, all delivered analysis-ready.
If you’re building any kind of monitoring workflow (EUDR plots, mine boundaries, urban growth, vegetation trends), start with the imagery and pricing on our satellite imagery page, or tell us what you’re trying to monitor and we’ll work out the right baseline-plus-tasking mix for it. You order, we make the dates match.
Frequently Asked Questions
What is change detection in remote sensing?
Change detection is the process of comparing satellite or aerial imagery of the same location from two or more dates to identify and measure what changed on the ground between them. The output is typically a change map that flags areas of genuine change, used for monitoring deforestation, urban growth, mining and disasters.
What satellites are best for change detection?
It depends on the scale. Sentinel-2 (10m, free, ~5-day revisit) and Landsat (30m, archive to 1972) are the standard choices for wide-area and historical monitoring. For object-level change, sub-metre satellites like Beijing-3, Jilin-1 and SuperView are needed, usually tasked to match an archive baseline.
How much imagery do you need for change detection?
A minimum of two images of the same area from different dates. For reliable monitoring you want more: a time series of consistent, near-anniversary captures, so you can separate genuine change from seasonal variation and one-off atmospheric noise rather than reacting to a single misleading pair.
Why does change detection produce false positives?
Most false change comes from inconsistency between the two dates: misaligned images, different sun angles, seasonal vegetation differences, or uncorrected atmospheric haze. Co-registering the images and converting both to atmospherically corrected surface reflectance removes the majority of these phantom changes before analysis.
How often do you need new imagery for change monitoring?
It depends on how fast the thing you’re tracking moves. Slow processes like urban sprawl or forest regrowth work fine on annual or seasonal captures. Active sites, like a working mine or a flood event, need weekly or even daily revisit. Match the capture frequency to the rate of change, not the other way round.