Satellite Imagery for Mineral Exploration and the Mining Lifecycle
How SWIR satellite imagery maps alteration minerals for exploration, measures disturbance for MRF and PRCP reporting, and tracks rehabilitation vegetation.
Summary
Satellite imagery is used in mineral exploration to map hydrothermal alteration minerals from orbit, before any ground team is deployed. Sensors that record shortwave infrared can distinguish clays, sulfates, iron oxides and carbonates by their absorption features, which narrows a large licence area down to a short list of targets. The same imagery later measures disturbance for regulators and tracks vegetation through rehabilitation.
- Exploration: SWIR bands identify alteration assemblages; panchromatic imagery maps the faults and fractures that control where mineralising fluids went.
- Operations: repeat captures measure disturbed area for Western Australia’s Mining Rehabilitation Fund and Queensland’s Progressive Rehabilitation and Closure Plan.
- Closure: multispectral indices quantify vegetation cover and plant health across rehabilitated ground.
- The limit worth knowing: satellite spectral mapping finds surface alteration. It does not find ore, and it cannot see through cover.
Satellite Imagery for Mineral Exploration
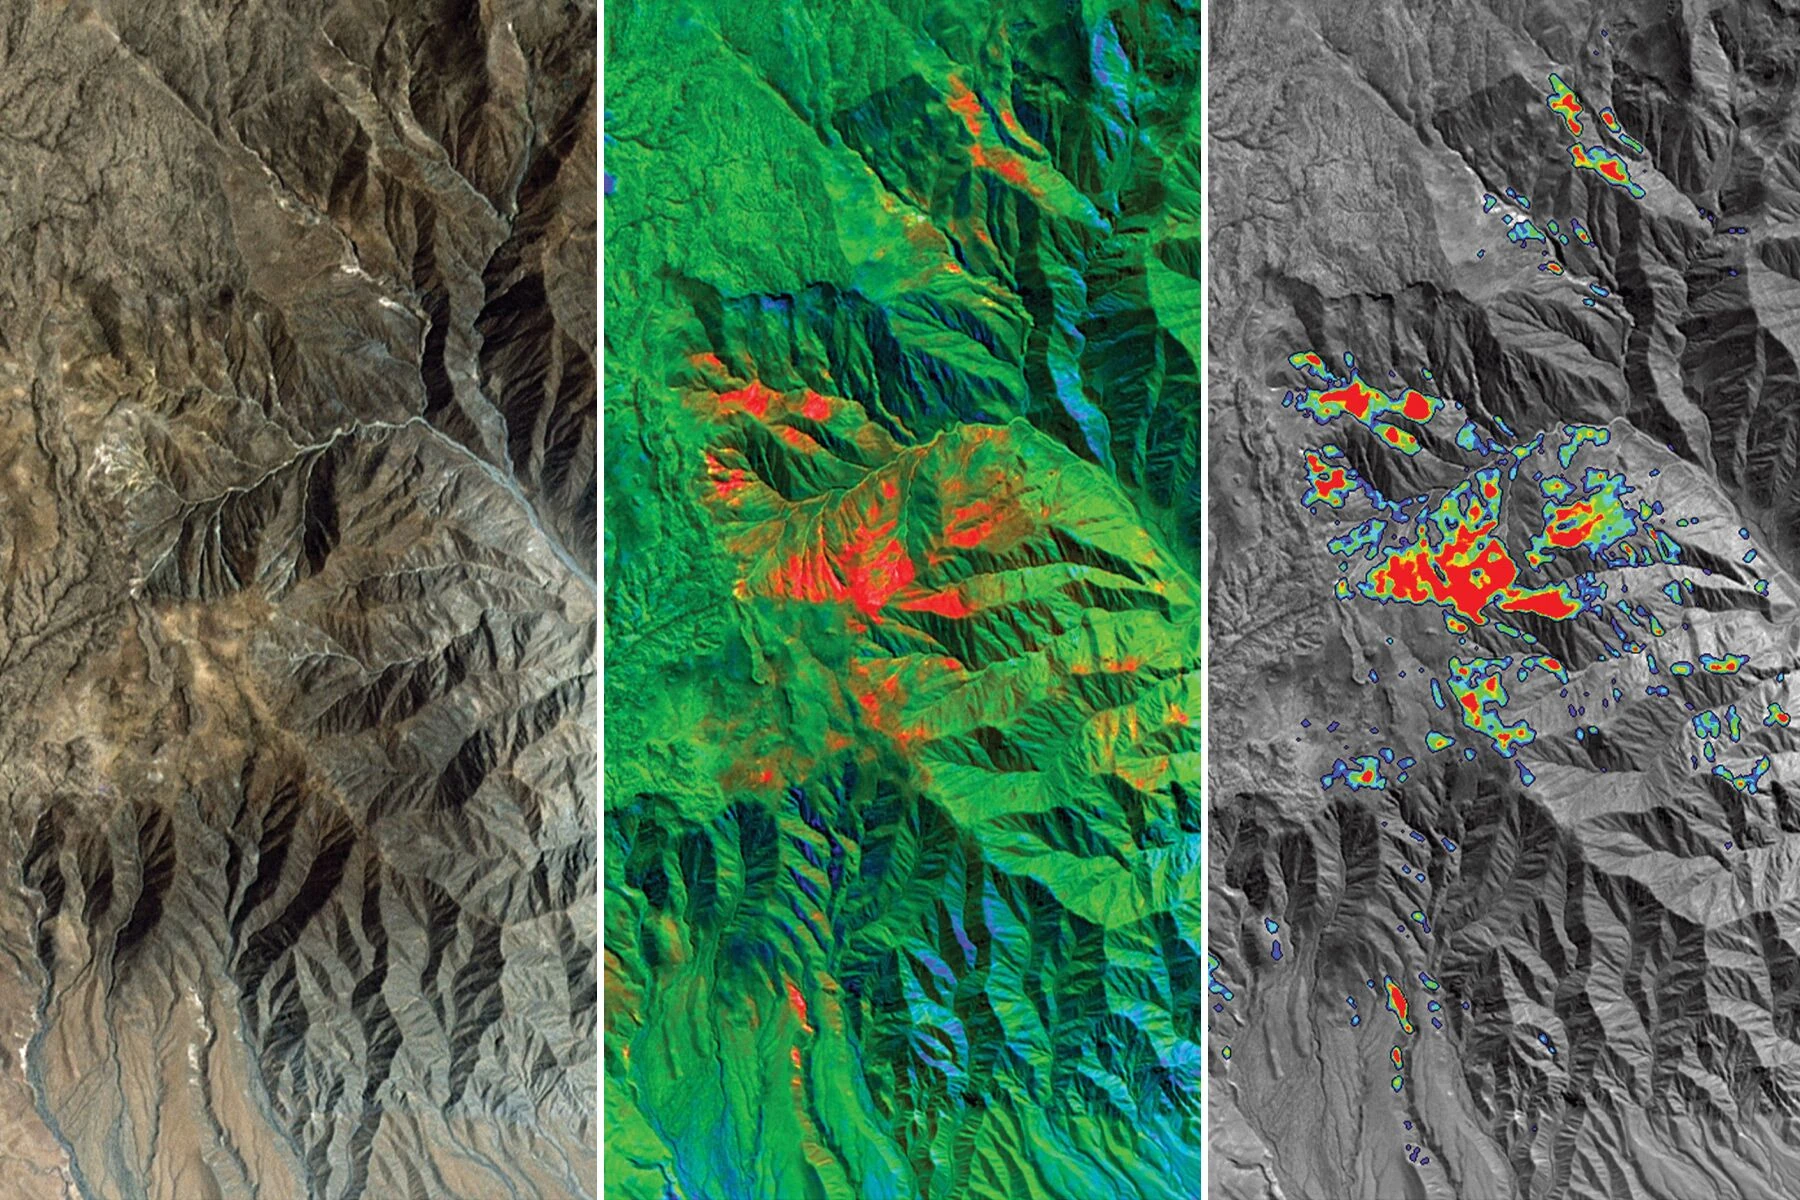
Hydrothermal alteration leaves a mineralogical halo around many deposits, and those minerals have diagnostic absorption features in the shortwave infrared. A sensor with enough SWIR bands can tell them apart from orbit.
WorldView-3 is the instrument most exploration teams reach for. Its SWIR sensor records 8 bands between 1195 and 2365 nm at 3.7 m resolution, which is fine enough to separate individual alteration minerals rather than lumping them into a general “clay” class. In a copper exploration project run with Arc GeoTech, that band set resolved four groups:
- Phyllosilicates: kaolinite, illite, smectite, muscovite, chlorite
- Sulfates: alunite, jarosite, gypsum
- Iron minerals: hematite, goethite, pyrite
- Carbonates: calcite, dolomite
Separating those matters because the assemblage carries information the presence of alteration alone does not. Alunite and kaolinite together point somewhere different from chlorite and calcite. The full method, including the band ratio formulations and the Spectral Angle Mapper classification against reference spectra, is written up in the WorldView-3 alteration mapping case study.
ASTER is the other name that comes up, and it deserves a caveat. Its 30 m SWIR data underpins a large part of the published exploration literature, but the SWIR subsystem has been unusable since 2008. Work using ASTER SWIR today is working from the pre-2008 archive, which is still valuable for regional reconnaissance and completely unhelpful if you need current conditions.
Structure, Not Just Spectra
Alteration tells you where fluids reacted. Structure tells you how they got there.
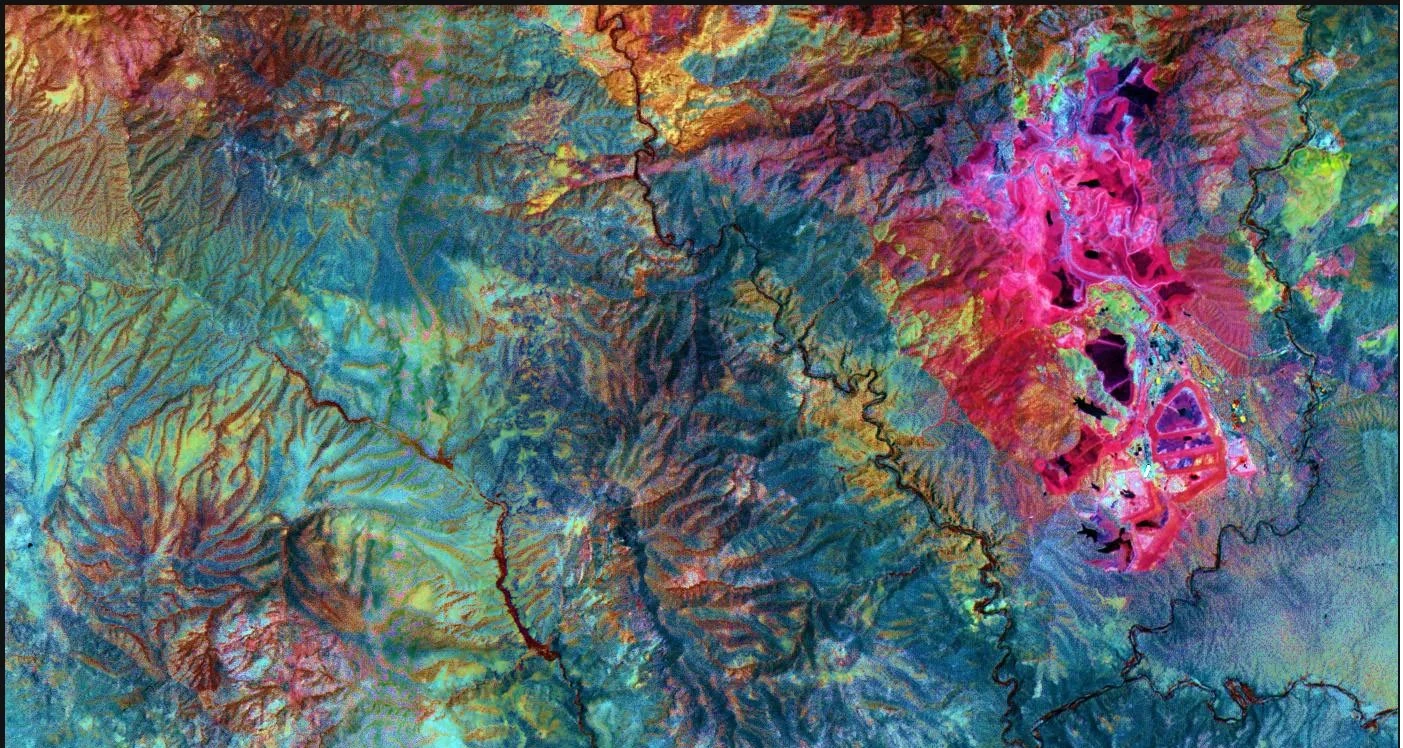
High-resolution panchromatic imagery, at 30 cm, resolves lineaments that are invisible at moderate resolution: faults, fractures, and the intersections between them. In the Arc GeoTech work, lineament analysis revealed a high-density fault network with primary NW-SE and NNW-SSE trends, and the mapped alteration zones correlated strongly with those structures.
That correlation is the useful part. An alteration anomaly sitting on a structural intersection is a better target than an equally strong anomaly sitting on nothing, and you can only make that call if you have mapped both.
What Spectral Mapping Cannot Do
Worth stating plainly, because the exploration literature is full of enthusiasm and thin on limits.
Satellite spectral mapping detects surface mineralogy. If the prospective geology is under transported cover, soil or dense vegetation, the sensor sees the cover. It also detects alteration, which is an indicator, not ore. Plenty of alteration systems are barren. What the imagery buys you is a ranked target list and a reason to put the drill rig in one valley rather than another, which is worth a great deal when ground access is expensive and the licence area is large.
Satellite Imagery for Operating Mine Sites
Once a site is operating, the question changes from “where should we look” to “what is the disturbed area this quarter, and can we prove it”.
Repeat satellite capture answers that. Western Australia’s Mining Rehabilitation Fund levy is calculated on disturbance, and Queensland’s Progressive Rehabilitation and Closure Plan requires demonstrated progress against a schedule. Both need an area measurement somebody else can check. Imagery with a timestamp and a documented processing chain gives you that in a form a regulator will accept.
Operationally, the same captures let teams:
- Measure disturbed area for regulatory reporting
- Track progressive rehabilitation against the approved plan
- Monitor impacts beyond the immediate lease boundary
- Document compliance with approved mining plans
- Watch infrastructure progress: haul roads, waste rock dump expansion, tailings storage facility construction
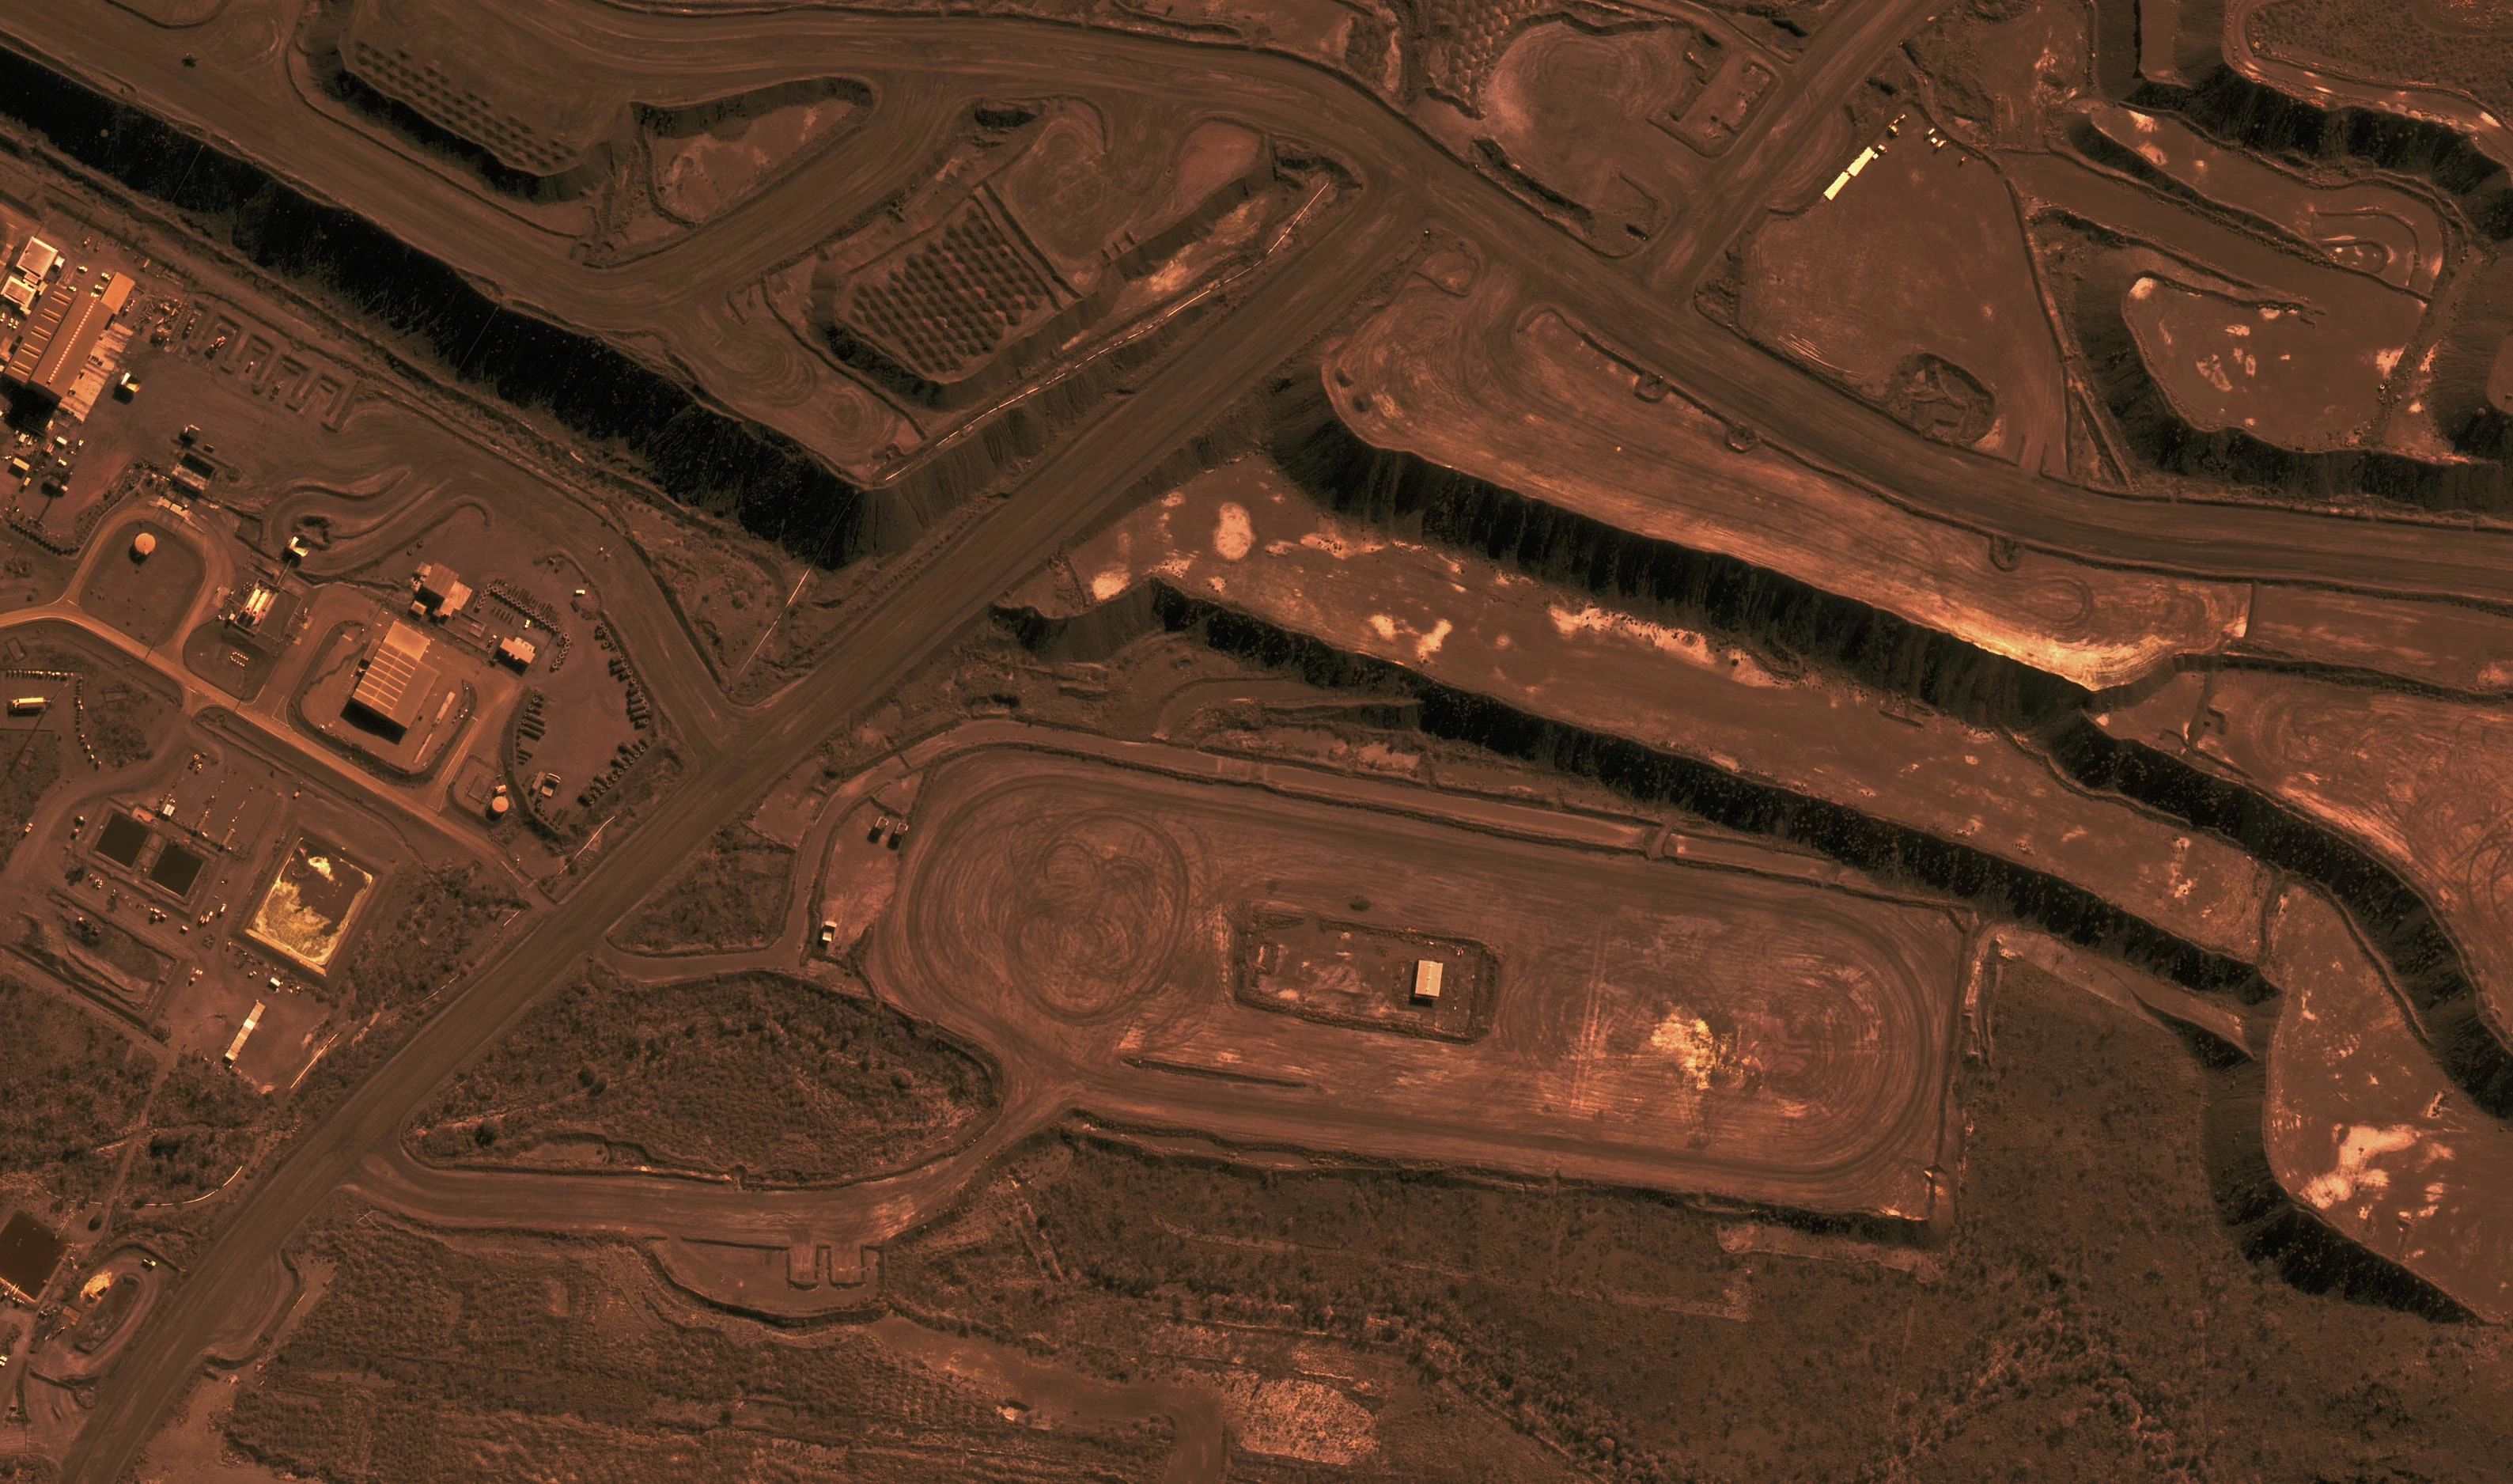
The comparison that matters is against the alternative. Ground survey is more accurate over a small area and becomes expensive over a large one. Aerial survey is sharper and needs an aircraft, a window of good weather, and scheduling. Satellite capture covers the whole lease in one pass and can be ordered against a specific date. For a quarterly disturbance figure across thousands of hectares, that trade usually favours satellite. For a volumetric on a single stockpile, it usually does not.
Satellite Imagery for Rehabilitation and Closure
Rehabilitation reporting is where satellite imagery earns its place most clearly, because the reporting period runs for years and the evidence has to be consistent across all of it.
Multispectral captures let environmental teams:
- Quantify vegetation cover across rehabilitated areas
- Assess plant health using vegetation indices
- Track establishment of target vegetation communities against the closure criteria
- Flag areas where establishment is failing, early enough to intervene
- Detect invasive species spread, which tends to show up as a spectral mismatch against the intended community
The before-and-after record is the deliverable for MRF and PRCP reporting. It is also the thing that is impossible to reconstruct retrospectively: if nobody captured the pre-disturbance baseline, no amount of later imagery will produce it. Archive imagery can sometimes fill that gap, which is one of the more common reasons mining clients go looking for old satellite images.
Making Captures Comparable Across Years
A rehabilitation record spanning eight years will draw on several sensors, because constellations change. Comparing them is not automatic. Different sensors have different band positions, different view geometries and different radiometric behaviour, so a vegetation index calculated naively across two of them will show a change that is an artefact of the instrument rather than anything on the ground.
Every Geopera order runs through the same chain before delivery: ingest, co-registration, ground control and ortho, pansharpening, atmospheric correction, cloud and shadow masking, seamline optimisation, harmonisation and QC, with nothing manual between stages. That is the Legato process, and its point here is narrow but important: sensors that disagree are made to behave like one instrument, so a time series assembled from several of them is measuring the site rather than the satellite.
Getting Started
Search the archive over your tenement at portal.geopera.com and see what exists and what it costs before committing to anything. Pricing is per area rather than per capture, which matters for monitoring work where you want several dates over the same footprint. The satellite imagery cost guide covers what each resolution tier costs, and the mining page covers how we work with exploration and environmental teams.