NAIP Imagery in 2026: What It Is and How to Download It
NAIP imagery explained: resolution, bands, update cycle, and where to download it now that USDA's Geospatial Data Gateway is offline.

Summary
- NAIP imagery is free, public-domain aerial photography of the 48 conterminous US states, flown for USDA’s National Agriculture Imagery Program every summer since 2003. The standard pixel has been 0.6 m since 2018, and in 22 states the newest scene we pulled was 0.3 m.
- Each state is reflown every two to three years, in the growing season. NAIP is a summer snapshot with leaves on the trees. It can’t tell you what a site looked like last month or last winter.
- The old download portal is gone. USDA took the Geospatial Data Gateway offline for good on 31 March 2026. NAIP now comes from USDA’s Box site, USGS EarthExplorer, the cloud archives on AWS and Microsoft’s Planetary Computer, or your state GIS office.
- The free catalogues run years behind the aircraft. On 11 November 2026 we queried two of the biggest. Neither held anything flown after 2023, and the USGS streaming service was still showing Washington state from August 2017.
- Read the acquisition date before you trust the picture. Where NAIP is too old, flown in the wrong season, or missing, sub-metre satellite archive is the usual next step.
If you work with maps of the United States, you’ve used NAIP imagery whether you knew it or not. It sits under county parcel viewers and state basemaps, and it’s a common base layer for land-cover mapping. The question most people bring to it is simple: how do I get it for my area, and how old will it be? We should say up front that Geopera sells satellite imagery, so weigh what we say about a free alternative with that in mind. NAIP is sharp, it costs nothing, you can do what you like with it, and for a great many jobs it’s all the imagery you need. What changed in 2026 is where it lives, and what most guides never mention is how far the free copies trail the aircraft.
What Is NAIP Imagery?
NAIP is the National Agriculture Imagery Program: aerial photography that the US Department of Agriculture collects over farmland, and over everything else in the lower 48, during the growing season. USDA uses it to check what was planted where. Everyone else gets a free orthophoto of the country as a side effect. The USGS archive page lists the programme as running from 2003 to the present, administered by the Geospatial Enterprise Operations branch of USDA’s Farm Production and Conservation Business Center in Salt Lake City. Older documents call the same office APFO, the Aerial Photography Field Office.
The aircraft belong to contractors. One of them announced in March 2026 that it had won $4.8 million of task orders covering 17 states, and described itself as one of five firms authorised to fly NAIP at scale. States and federal agencies can pay to upgrade their year. A USDA programme update from November 2023 lists the options: finer pixels of 15 to 30 cm, digital surface models and stereo coverage. That is why two neighbouring states can come out of the same summer at different resolutions. In Microsoft’s Planetary Computer, the newest scene is 0.3 m for 22 of the 48 states and 0.6 m for the rest.
NAIP Imagery Resolution, Bands and Accuracy
| Property | What NAIP delivers |
|---|---|
| Pixel size | 1 m from 2003 to 2017. 0.6 m standard since 2018, with 0.3 m in states that paid for it |
| Bands | Red, green, blue and near infrared |
| Season | Agricultural growing season, leaves on |
| Repeat cycle | Five years from 2003, three years or less from 2009, about two years for many states now |
| Accuracy | Contract specification: within 6 m of true ground at 95% confidence |
| Cloud | Up to 10% cloud cover allowed per tile |
| Tile | A 3.75-minute quarter quadrangle plus a 300 m buffer, in UTM on NAD83 |
| Coverage | The 48 conterminous states |
| Licence | Public domain |
Sources: the USGS archive page above, and the AWS open data registry entry for the current cycle.
Two rows deserve a second look. The accuracy figure is a floor written into contracts, and recent years do better: Utah’s state GIS office quotes ±4 m for 2018 onwards. Even so, 4 m is seven pixels of 0.6 m imagery, so a building corner in NAIP can sit a car length from where a survey puts it. Pixel size and positional accuracy are separate numbers, which we cover in our ground sample distance explainer.
The near-infrared band is the one people overlook. Healthy leaves reflect strongly in near infrared and absorb red, so four-band NAIP gives you NDVI at 0.6 m for free. The catch is the calendar: one summer date every two or three years. Our vegetation indices guide explains what a single-date index can and can’t tell you.
How to Download NAIP Imagery in 2026
For years the standard answer was the USDA Geospatial Data Gateway. That answer is dead. The Gateway’s own front page now reads: “The USDA NRCS Geospatial Data Gateway has been permanently taken offline as of March 31, 2026.” USDA gives the reason as a move from its own servers to cloud storage, which the old platform couldn’t support, and says future cloud access options will be announced when they exist. Any tutorial that starts with “go to the Data Gateway” predates that notice.
What’s left is a handful of doors, and they don’t all open onto the same imagery.
| Source | What you get | Good for |
|---|---|---|
| USDA Box site | Compressed county mosaics, one file per county, including the 2025 season | The newest year, one county at a time |
| USGS EarthExplorer | Quarter-quad tiles as GeoTIFF or JPEG2000, under aerial photography | Picking individual tiles and older years |
| Microsoft Planetary Computer | Cloud-optimised GeoTIFFs behind a STAC API, 2010 to 2023 | Scripts and large areas |
| NAIP on AWS | Three requester-pays buckets, 2010 to 2023 for most products | Processing inside AWS |
| USGS National Map image service | A streamed mosaic with natural colour, colour infrared and NDVI views | A basemap in QGIS or ArcGIS |
| State GIS offices | Statewide services and downloads | Often the first place a new year appears |
USDA Box is where the Gateway’s files went. County mosaics sit at nrcs.app.box.com/v/naip, and the retirement notice points to a wider folder for other datasets. A compressed county mosaic is every quarter quad in a county squeezed into one file, usually MrSID. Mississippi’s state mapping office describes its 2025 county files as about 2.5 GB each. They’re built for looking at. The compression is lossy, so use the tiles if you plan to compute anything.
USGS EarthExplorer carries the uncompressed tiles. Search your area, open the aerial photography category, tick NAIP, and each result lists its acquisition date. Downloads need a free USGS account. For imagery that has been flown but hasn’t reached EarthExplorer, USGS sends you to USDA’s customer service desk in Salt Lake City.
The cloud archives suit anyone who would rather write a query than click through a map. Microsoft’s Planetary Computer serves NAIP as cloud-optimised GeoTIFFs with a searchable catalogue, so a script can read just the window it needs. The AWS copy is managed by Esri in three buckets (analytic, source and visualisation), all set to Requester Pays, which means the data is free and the transfer is billed to your AWS account.
The streaming service is the one most people meet first, because it drops into desktop GIS as a layer. It lives at imagery.nationalmap.gov/arcgis/rest/services/USGSNAIPImagery/ImageServer, and our QGIS imagery guide shows how to add a service like it. One request returns at most 4,000 by 4,000 pixels.
State offices are worth a look before any of the above. North Dakota’s GIS hub was serving 2025 NAIP at 30 cm by March 2026, and Montana, Minnesota and Mississippi have each published their 2025 flights. None of that appears in the national catalogues yet.
How Old Is the NAIP Imagery You’re Looking At?
This part surprised us. We asked two of the national catalogues the same question on 11 November 2026: what is the newest NAIP year you hold for each state?
Newest NAIP year held for each state, by catalogue
The streaming service holds one year per state. Twenty states show 2023, seventeen show 2022, and eleven are older. Washington is still on its 2017 flight at 1 m.
Neither catalogue holds a single scene from 2024, 2025 or 2026. Those years were flown. Utah lists a 2024 collection, and North Dakota, Montana, Minnesota and Mississippi have published 2025. So the newest NAIP anywhere is one season old, the newest in the big cloud catalogues is three, and the copy that streams into desktop GIS is anything up to nine.
Washington shows what that gap looks like on the ground. Seattle’s Alaskan Way Viaduct, a double-deck highway along the waterfront, came down in 2019. Ask the USGS service for the waterfront today and the viaduct is still standing.
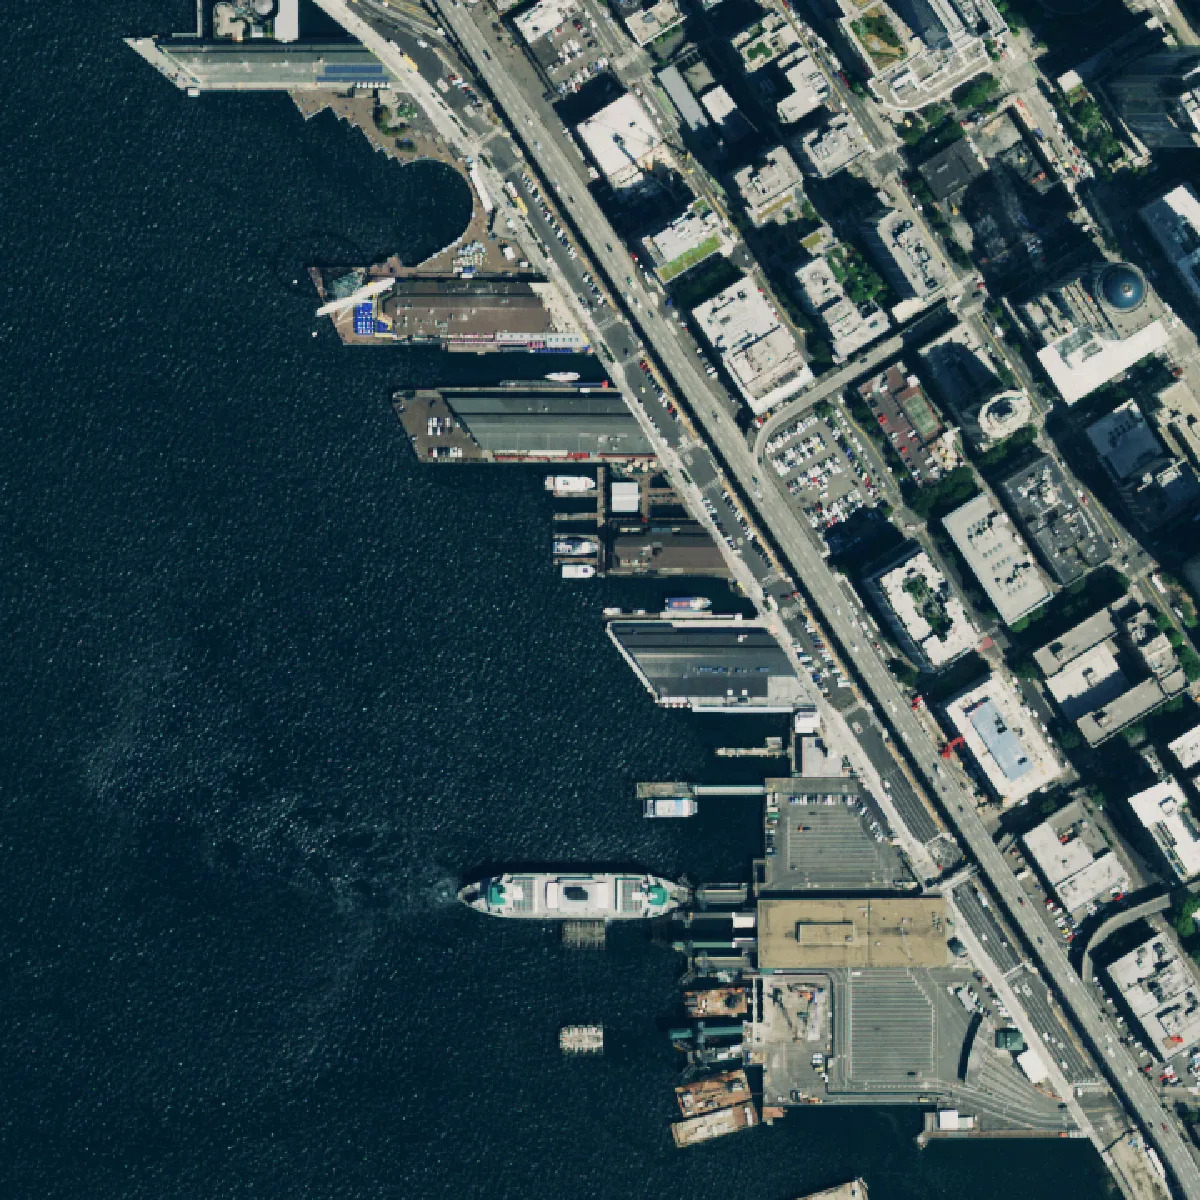

Both pictures are NAIP, free, and what a public catalogue handed us on the same afternoon. Nothing in either one says which is current. The date is in the metadata, and you have to go and read it.
Reading it takes a minute. In EarthExplorer, every result carries its acquisition date. In the streaming service, an identify click on the footprint returns the year and date. And the file name itself tells you: the 2023 Seattle tile is m_4712230_nw_10_060_20231007_20240209. The 060 is the pixel size in centimetres. The first date, 7 October 2023, is the flight. The second, 9 February 2024, is the date the file was produced, four months later.
Four months is about what to expect. Wisconsin’s State Cartographer’s Office reported that the state’s 2026 flights began on 12 July, were about 70% complete on 26 October, and that public data was “likely early next year.” So a NAIP year becomes downloadable the winter after it’s flown, reaches the national catalogues some time after that, and is replaced two or three summers later.
Where NAIP Runs Out
NAIP’s limits come from its job. It’s built to photograph crops, and the things that make it good at that make it awkward for other work.
The first limit is the calendar. A state on a two-year cycle, with files arriving the following winter, is showing you ground that is between six months and two and a half years old on the best day, from the best source. A subdivision, a mine pit or a solar farm can go from bare dirt to finished inside that window.
Season is the second. Leaf-on imagery hides what sits under a canopy: streams, fence lines, tracks, the footprint of a building under trees. Engineers and foresters often want the opposite, a leaf-off winter image, and NAIP doesn’t fly in winter. Summer also stretches. USDA’s November 2023 update records a contractor needing flight-season extensions that year after Canadian wildfires and bad weather, and the newest Montana and Idaho scenes in the Planetary Computer are dated 17 November.
Third, the schedule isn’t yours. North Dakota’s GIS hub told users in March 2026 that “it appears that North Dakota will not have imagery collected for the 2026 NAIP”, and asked them for letters of support and funding to protect future collections. The programme runs on cost-share money, and a state can drop out of a year.
Coverage is the last one. Neither catalogue we queried holds Alaska, Hawaii or Puerto Rico. USDA has flown Hawaii and Puerto Rico in some years, but they sit outside the regular cycle.
It would be easy to read this as a case against NAIP. It isn’t one. If a 2023 summer image answers your question, download it and you’re finished, and it cost nothing. The trouble only starts when the work needs a date NAIP didn’t fly.
When Satellite Imagery Fills the Gap
A satellite doesn’t wait for a flying season. Sub-metre commercial satellites pass over any given US site many times a year, and what they collect goes into an archive you can search by date. That’s the practical difference: NAIP gives you the summer USDA chose, and an archive lets you pick from whatever was captured.
| Question | NAIP | Sub-metre satellite archive and tasking |
|---|---|---|
| Price | Free | Paid per km², with a minimum order area |
| Pixel size | 0.6 m, or 0.3 m in upgraded states | 0.3 m to 0.5 m |
| How recent | One to three years, summer only | Often weeks, any season, cloud permitting |
| Choose the date | No | Yes, from the archive, or by ordering a capture |
| Outside the lower 48 | Irregular | Global |
| Licence | Public domain | Licensed to the buyer |
Neither column wins outright. NAIP at 0.3 m matches the sharpest commercial satellites pixel for pixel, costs nothing and carries no licence terms. A satellite image costs money, is taken at an angle more often than not, and can be lost to cloud. Our comparison of drone, aerial and satellite imagery goes through when each one wins.
This is the gap Geopera works in. Pera Portal searches commercial archive from more than 100 satellites, with NAIP, Sentinel-2 and Landsat in the same search, so the free and paid options for a site come up together, each with its capture date. Sentinel-2 is free in the portal at 10 m, which is often enough to check whether a site has changed before you pay for anything sharper. Where the archive has nothing on the date you need, tasking books a new capture from sensors such as WorldView-3. Every optical order is orthorectified, pansharpened and atmospherically corrected before delivery, and the rate card is public.
So start with NAIP, and read its date before you use it. When that date is older than the question you’re asking, look at what has flown over since.
Frequently Asked Questions
What is NAIP imagery?
NAIP (National Agriculture Imagery Program) imagery is free aerial photography of the 48 conterminous US states, flown for USDA during the growing season since 2003. It’s orthorectified, public domain, carries red, green, blue and near-infrared bands, and has had a 0.6 m standard pixel since 2018.
How to download NAIP imagery?
Use USDA’s Box site for county mosaics, or USGS EarthExplorer for individual GeoTIFF tiles. The USDA Geospatial Data Gateway went offline permanently on 31 March 2026. For scripted access, Microsoft’s Planetary Computer and the NAIP buckets on AWS hold cloud-optimised GeoTIFFs from 2010 to 2023.
What is the resolution of NAIP imagery?
NAIP’s standard resolution is 0.6 m per pixel, and has been since 2018. From 2003 to 2017 it was 1 m. Many states now pay to upgrade to 0.3 m, and USDA lists 15 cm as a further option. The contract accuracy specification is 6 m at 95% confidence.
How often is NAIP imagery updated?
Each state is reflown every two to three years, with between a third and a half of the country flown each summer. New imagery usually becomes public the following winter. Free catalogues can lag further: in November 2026 the USGS streaming service held nothing newer than 2023, and showed Washington from 2017.
Is NAIP imagery free for commercial use?
Yes. NAIP is in the public domain, and USGS lists its usage terms as “Public Domain.” You can use it in paid work, publish it and build products on it. The AWS registry asks for attribution. Data transfer from the AWS buckets is billed to the requester.