How Disturbed Area Is Measured for MRF Reporting
WA's Mining Rehabilitation Fund levy is charged per disturbed hectare. How disturbed area is measured for MRF reporting, and why the number matters.
Summary
- The Mining Rehabilitation Fund (MRF) levy is charged by the hectare. Each year the levy comes to 1% of a tenement’s Rehabilitation Liability Estimate, and that estimate is just your disturbed area in each category multiplied by a per-hectare rate, then added up. Every hectare you report is a line on a recurring bill.
- You measure and report the disturbed area yourself. The department doesn’t check your figure when you lodge it. It audits a sample afterwards. Overstate the area and you overpay the levy every year; understate it and a false or misleading return carries a penalty of up to $20,000.
- Unit rates run from about $2,000/ha to $50,000/ha depending on what the disturbance is. A hundred hectares carried at the wrong rate, or never cleared off the books, quietly moves real money.
- Measurement error goes both ways. In a single year’s audit sample, WA’s mines department clawed back $386,853 in extra levies and refunded $37,667. Operators were both under-reporting and over-reporting their disturbed area.
- Satellite imagery gives an independent, dated, repeatable measurement of the footprint that lines up with the annual reporting cycle. The WA Auditor General has recommended exactly this kind of imagery to verify operator-reported ground disturbance.
The most expensive number on a West Australian mining tenement isn’t the ore grade or the strip ratio. It’s a figure in hectares that someone on the environmental team types into an annual return: the disturbed area.
Get it slightly wrong in one direction and the company overpays the Mining Rehabilitation Fund (MRF) levy, year after year, on disturbance that isn’t really there. Get it wrong the other way and you’ve filed a return that understates your footprint, which is a problem the day an auditor pulls your tenement. Same number. Two ways to lose money. And almost nobody outside the compliance team has a clear picture of how that number is actually meant to be measured.
This is the guide that connects the two halves nobody connects: the regulation that prices your disturbance by the hectare, and the measurement method that decides whether the hectare figure is right.
What the Mining Rehabilitation Fund Actually Charges You For
Start with the money, because the money is the whole reason measurement matters.
The MRF is Western Australia’s pooled rehabilitation fund, set up under the Mining Rehabilitation Fund Act 2012 and administered by DMPE, the Department of Mines, Petroleum and Exploration (the agency that replaced DEMIRS in July 2025). Instead of every tenement holder lodging an individual rehabilitation bond, holders pay a small annual levy into one shared fund. That pool pays to rehabilitate abandoned mine sites once every avenue to recover the cost from the operator has run out. By 30 June 2025 it had grown to roughly $356 million, with about $51.6 million in levies assessed for the 2024-25 year alone.
Here’s the part that runs your bill. The levy on each mining authorisation is 1% of its Rehabilitation Liability Estimate, or RLE. And the RLE is built from one input: area.
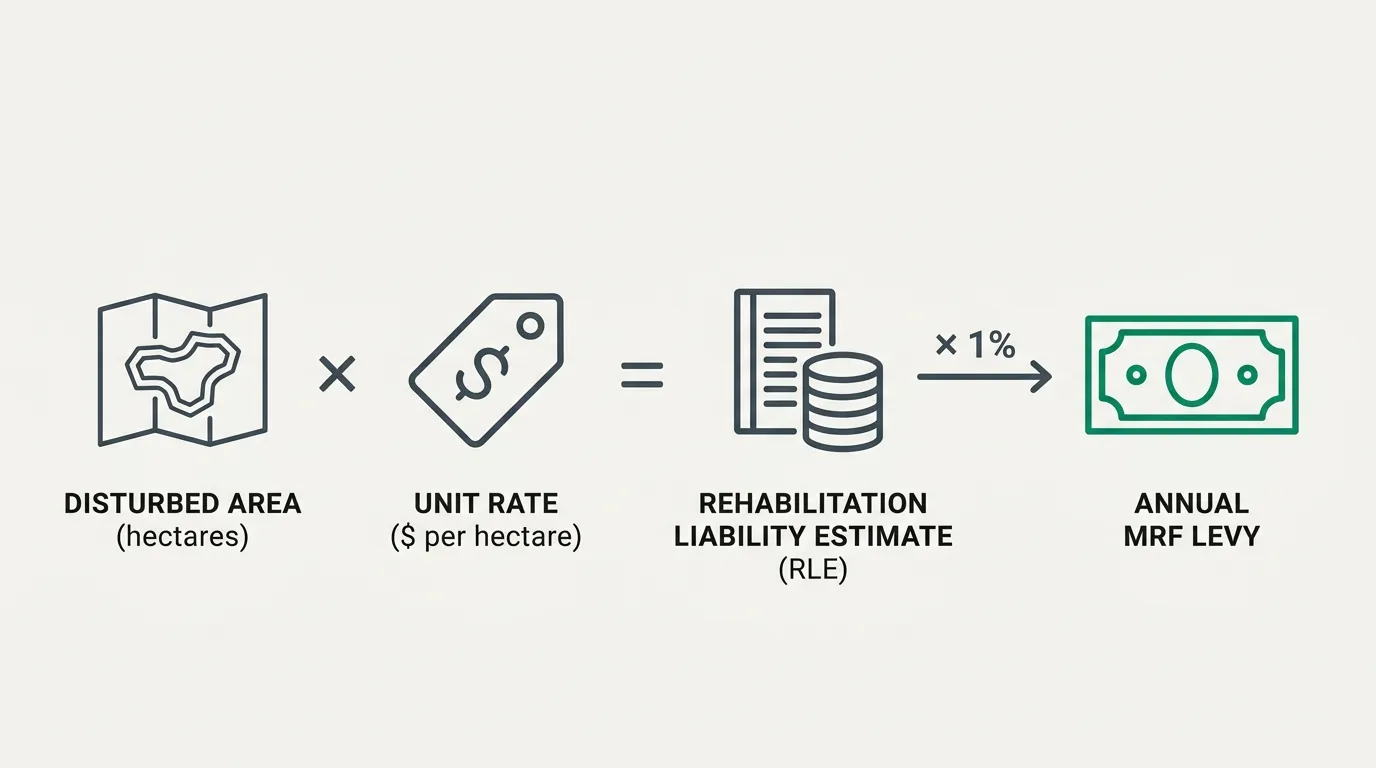
The per-hectare rates aren’t flat. They’re set in Schedule 1 of the regulations and scale with how expensive that kind of disturbance is to rehabilitate. Exploration disturbance and land you’ve already started rehabilitating sit near the bottom at around $2,000/ha. A large or hazardous tailings storage facility sits at the top, around $50,000/ha. Everything else lands somewhere between.
| Disturbance type (example) | Indicative unit rate (A$ per ha) |
|---|---|
| Exploration disturbance, or land under rehabilitation | $2,000 |
| Salt or halite stockpile (minerals-in-brine) | $10,000 |
| Plant site, workshop, fresh-water dam | $18,000 |
| Minerals-in-brine evaporation pond | $20,000 |
| Large waste dump or overburden stockpile | $30,000 |
| Large or hazardous tailings storage facility | $50,000 |
Those figures are indicative. Your exact category list and rates live in Schedule 1 of the Mining Rehabilitation Fund Regulations 2013, and DMPE’s RLE Calculator will work out the real number for your tenement once you feed it the areas. Which is the catch. The calculator is only ever as good as the hectare figures you type in, and it has no way of knowing whether those figures match what’s actually on the ground.
A few mechanics worth pinning down, because they shape how the measurement gets used:
- You report in hectares, to at least two decimal places. Acres and square metres aren’t accepted. The area is a cumulative snapshot of total disturbance “as at” a date you choose, not just what you disturbed during the year.
- The reporting period runs 1 July to 30 June, and returns are lodged through DMPE’s online EARS2 system on or before 30 June each year.
- If your RLE comes to $50,000 or less, the levy is nil, but you still have to report your disturbance. Plenty of small operators sit under that line, which makes the area figure the thing that keeps them under it or tips them over.
So the regulation is clear about what you owe and dead silent about how to measure the input. That silence is the whole story.
Why Disturbed Area Is the Most Expensive Number You Report
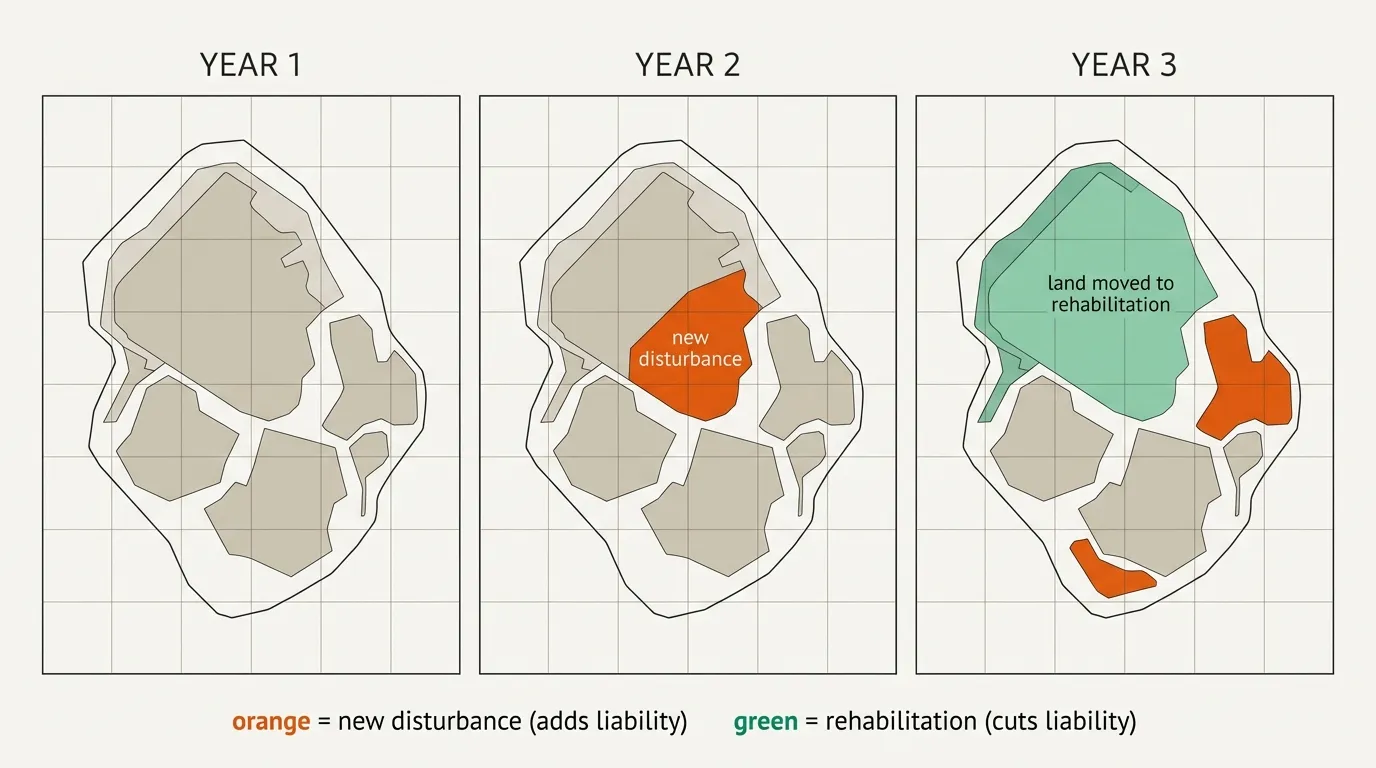
Most numbers on a compliance form are one-offs. The disturbed-area figure isn’t. It’s cumulative and it recurs, which means an error in it doesn’t cost you once. It costs you every year until someone catches it.
Run the arithmetic. Say 100 hectares is sitting in your return at a $10,000/ha rate when it shouldn’t be, maybe it’s old mine-plan area that was never actually cleared, or ground that’s quietly revegetated and should have been reclassified. That’s $1,000,000 of phantom liability bolted onto your RLE. At the 1% levy, you’re handing over an extra $10,000 a year, indefinitely, for disturbance that isn’t there. Nobody sends you a refund for the years you overpaid before you noticed.
Now the other direction. Under-report the area and yes, the levy drops in the short term. But the figures you lodge have to be supported by evidence you can produce on audit, and a return that’s false or misleading in a material particular carries a penalty of up to $20,000. There’s a modified penalty regime too: $4,000 per tenement for missing the deadline. In 2023-24 the department served 171 of those infringement notices in a single reporting round.
This isn’t hypothetical. DMPE runs an annual compliance assessment on a sample of returns, and the results show how often the area is simply wrong.
That refund figure is the one most operators miss. The instinct is to treat MRF reporting as a cost you minimise by reporting less. The audit data says a chunk of the industry is overpaying, sitting on overstated or stale disturbance that an accurate measurement would clear off the books. Accuracy isn’t only a compliance shield. It’s a cost-control lever pointing both ways.
How Disturbed Area Gets Measured Today
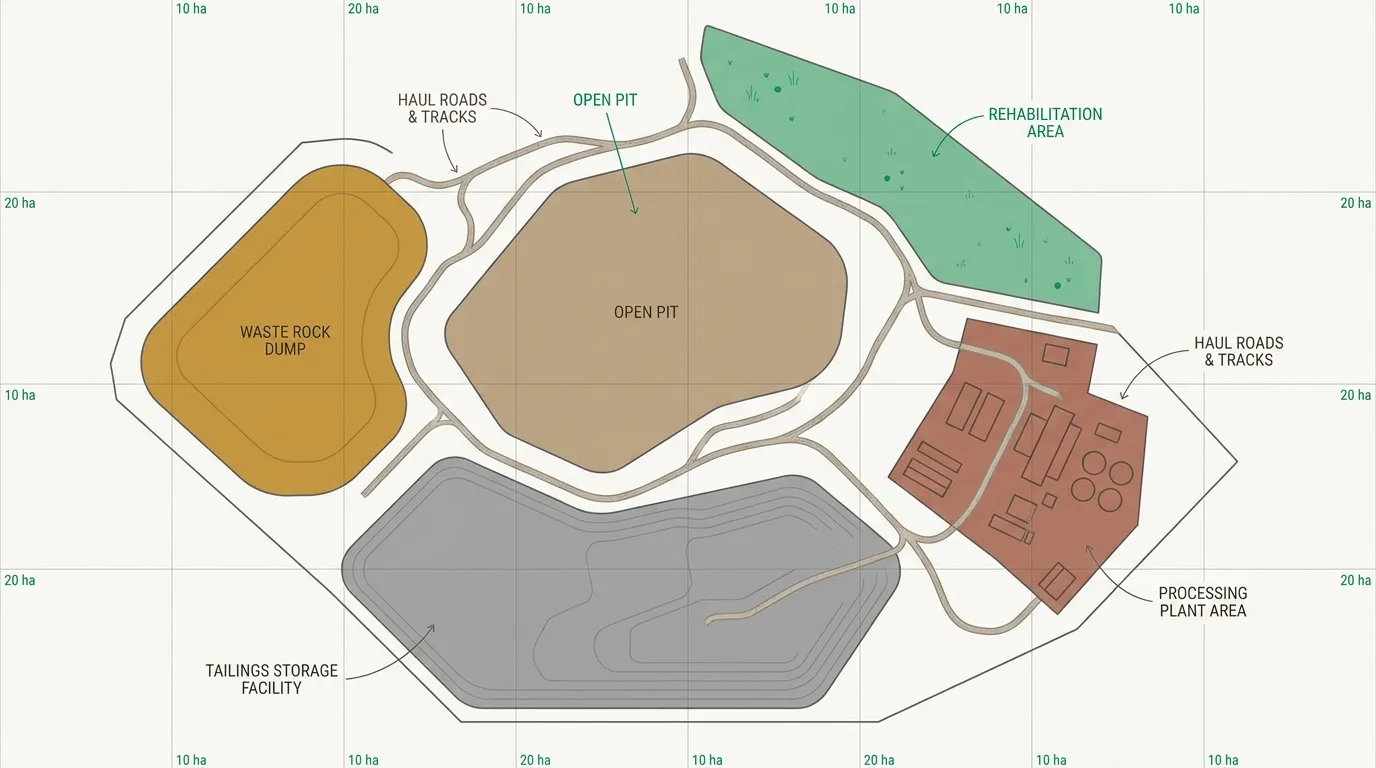
Here’s the thing the official guidance never spells out. It tells you the area must be accurately measured and that it’s your responsibility, then stops. It doesn’t tell you how. So in practice, tenement holders fall back on a handful of methods, each with a gap.
GIS mine-plan polygons. The cheapest and most common. You already have the planned footprint in your mine’s GIS, so you sum the hectares per category and lodge them. The problem is right there in the word planned. Designed footprints and real ground don’t match. Clearing over-runs or under-runs the plan, infrastructure shifts, and last year’s polygons drift out of date. These figures are self-drawn and self-reported, which is exactly why they’re the ones an auditor most wants to check against something independent.
Ground and GPS survey. Walk it or drive it with RTK GNSS and you get survey-grade boundaries, accurate to a few centimetres. That’s the gold standard for a single boundary. It’s also slow, expensive, and unsafe along active pit walls, so it gets done in campaigns over small areas, not across a whole tenement every year. Brilliant for validating a spot. Impractical for measuring your entire footprint annually.
Drones. An RTK-enabled drone matches survey accuracy and covers a hundred-plus acres in under an hour, far faster than a ground crew. But the swath is small. Covering a large tenement, or a portfolio of scattered ones, means many flights, mobilisation cost, and CASA approvals, and weather and battery life cap how much you get per trip. So it shines on a single rehab cell and bogs down across a whole operation.
Aerial photography. High resolution over a wide area in one sortie, but you’re commissioning flights, so captures are sporadic and pricey, and consistent annual coverage of every tenement rarely stacks up economically.
Notice the pattern. The methods that are accurate don’t scale, and the method that scales, the desktop GIS polygon, isn’t an actual measurement of the ground. So how defensible is each one the day someone asks you to prove your number?
Measuring the Disturbance Footprint From Satellite Imagery
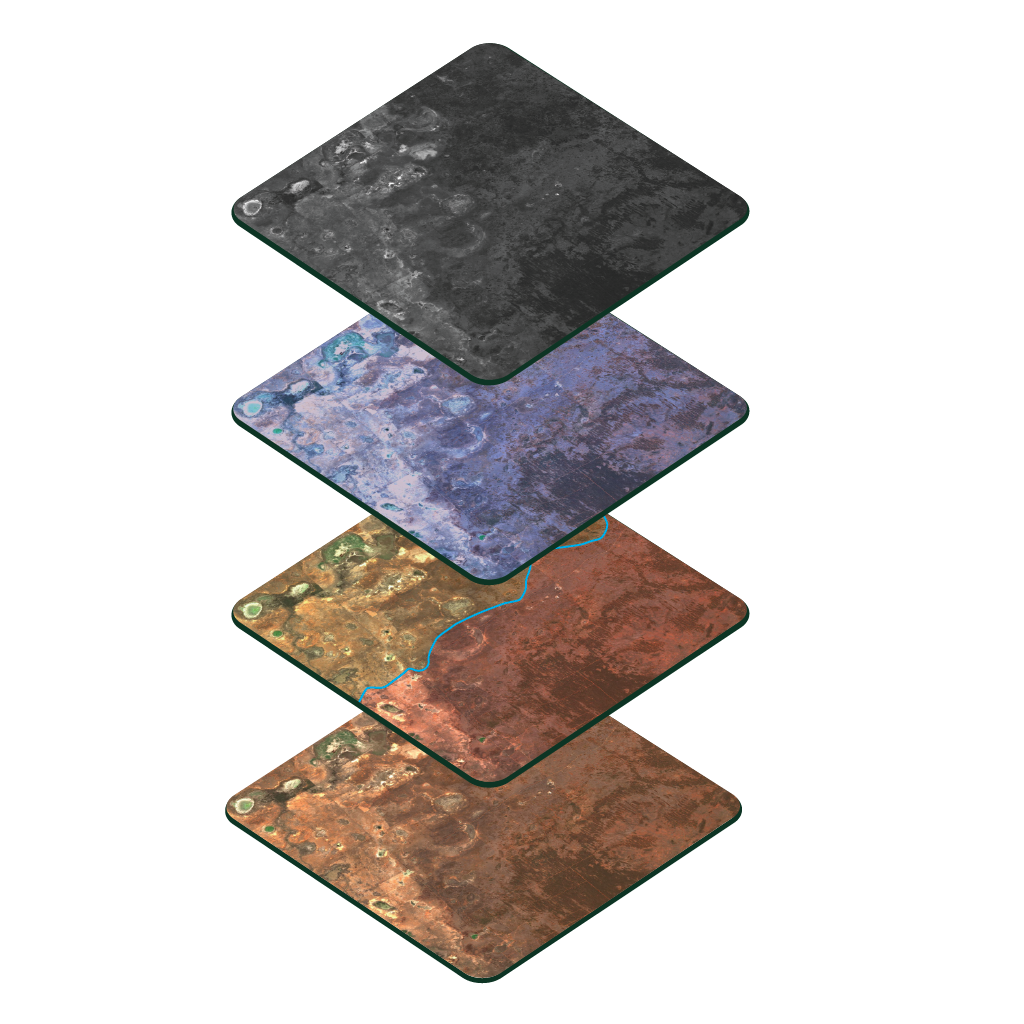
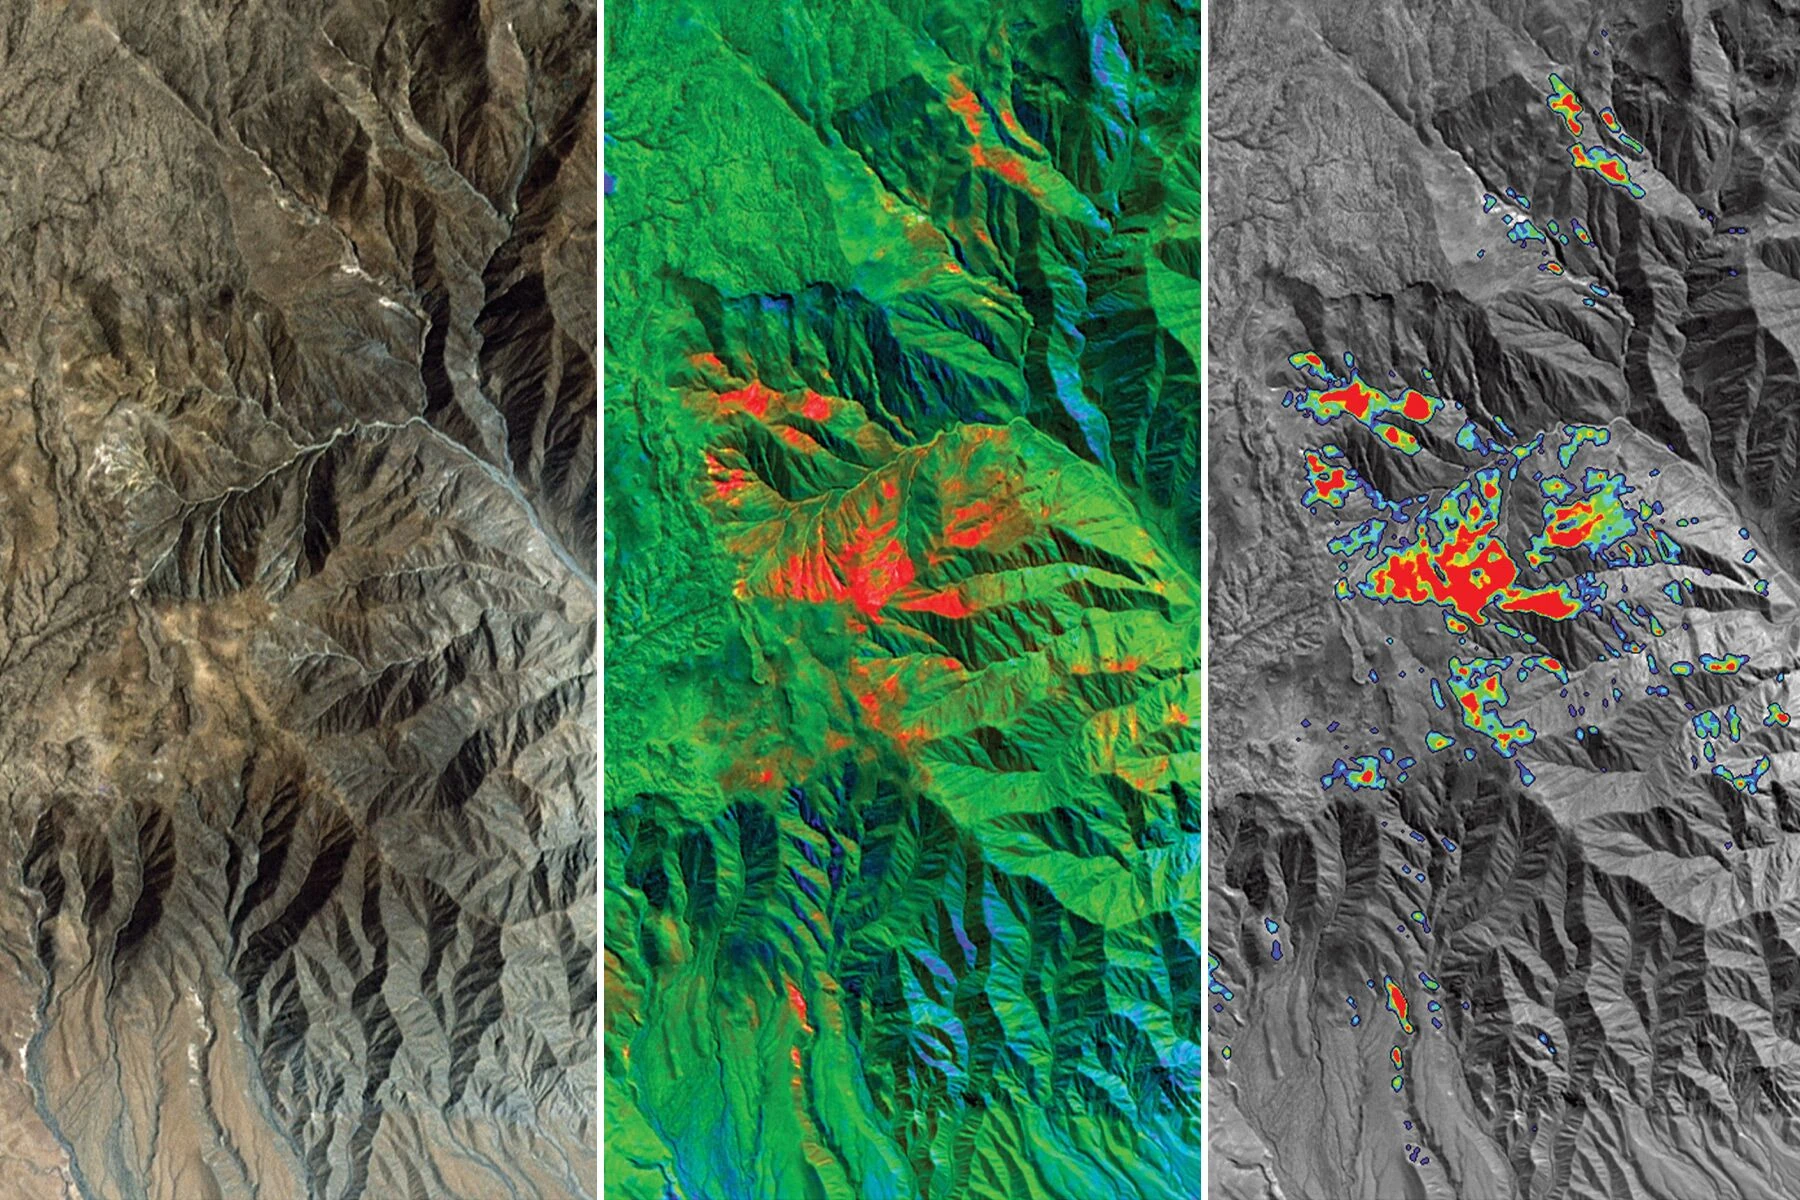
Satellite imagery answers the question the regulation asks and never explains: how do you produce an accurate, repeatable, defensible disturbance footprint across a whole tenement, on demand, every year?
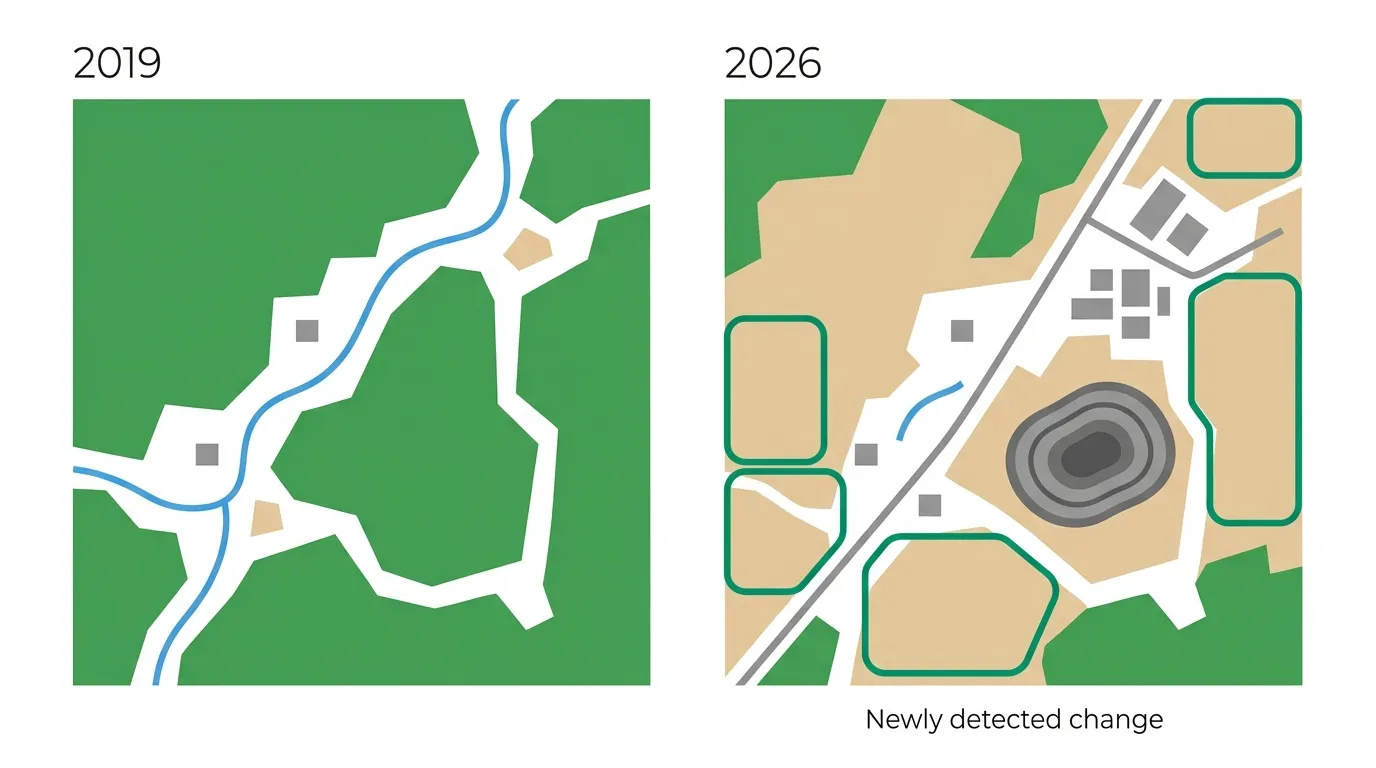
The method is straightforward in principle. Classify each pixel in a recent capture as disturbed ground or vegetation, trace the boundary of the disturbed area, and compute the hectares inside it per category. Bare-soil indices like the Bare Soil Index pick out exposed ground where the vegetation’s been stripped, which is most of what “disturbance” looks like from orbit. Then you compare against earlier captures using satellite change detection to see what’s new disturbance and what’s land that’s started recovering. The mechanics of that comparison, and why getting it right is mostly about consistency between dates, are the same ones we walk through for satellite imagery across the mining lifecycle.
What makes it fit MRF specifically is the combination of three things the other methods can’t all offer at once.
It’s synoptic. One pass images an entire tenement, or a whole portfolio of them, in a single consistent capture. No mobilisation, no flight planning, no walking the pit edge.
The measurement also repeats, and it’s dated. Sentinel-2 revisits roughly every five days, and commercial constellations can go daily, so a clean annual snapshot to match the 30 June return is trivially available. Better still, it’s measured the same way every cycle, so this year’s number is genuinely comparable to last year’s instead of being two people’s readings of two different mine plans.
And because the imagery comes from an external source with a timestamp, it’s independent in the way that counts on audit. That’s the quality that turns “our GIS says 80 hectares” into “here’s dated imagery showing 80 hectares, georeferenced, that you can re-measure yourself.”
There’s a resolution trade-off to be honest about. At Sentinel-2’s free 10 metres, the smallest feature you can reliably map is around half a hectare, so narrow haul tracks, drill pads and thin slivers of clearing slip below the grid. Push to sub-metre commercial imagery and the minimum mapping unit drops to roughly a tenth of a hectare, sharp enough to trace the actual edge of every cleared parcel. For a sprawling operation you often want both: free Sentinel-2 and Landsat to measure the broad footprint cheaply, and a tasked sub-metre capture over the fiddly bits where the boundary has to be exact. Studies of satellite mine-disturbance mapping routinely report classification accuracies above 90%, well inside what a hectare-level return needs.
| Resolution tier | Smallest reliable feature | Cost | Best use for MRF |
|---|---|---|---|
| Sentinel-2 (10m, free) | ~0.5 ha | Free | Whole-tenement footprint, broad annual change |
| Sub-metre commercial (Beijing-3, Jilin-1, SuperView) | ~0.1 ha | Tasked / archive | Exact boundaries, tracks, drill pads, small parcels |
| Drone / GPS | Centimetres | High per ha | Spot validation, a single rehab cell |
Turning Rehabilitation Into a Smaller Levy
Now the lever that actually saves money, and the reason measurement matters on the way down as much as the way up.
The MRF doesn’t reward rehabilitation with a discount multiplier. It rewards it by reclassification. Land sitting in an active disturbance category at, say, $18,000/ha doesn’t get a percentage knocked off as you rehabilitate it. Instead, once the closure earthworks are done, you move that area into the “land under rehabilitation” category at $2,000/ha. And once a DMPE environmental officer signs it off as fully rehabilitated, it drops off your return entirely, at which point it stops costing you anything.
The saving is steep because the gap between the categories is steep. Move 50 hectares from an $18,000/ha active category down to the $2,000/ha rehabilitation rate and you’ve cut $800,000 off your RLE, which is $8,000 a year off the levy. You can report progressive rehabilitation pro-rata too, so finishing earthworks on half of a 10-hectare laydown lets you split it: five hectares disturbed, five under rehabilitation.
But, and this is where a lot of operators leave money on the table, you only get the reclassification once you can prove the area qualifies. The rehabilitation criteria are vegetation-based: native cover re-establishing toward what the surrounding landscape looks like. You can’t claim that with a stale mine-plan polygon. You need a measured vegetation signal showing recovery, and a delineated boundary around the recovering area, both of which an auditor can interrogate.
That’s a measurement problem, and it’s one satellite imagery is built for. Tracking NDVI and other vegetation indices over a rehab cell gives you an objective, dated record of cover returning, which is the evidence that backs the reclassification. We go deeper on the vegetation side of this in our guide to vegetation management with satellite data. The same annual capture that measures your active disturbance also measures your recovery, so one consistent dataset drives both halves of the return.
What an Audit-Ready Disturbance Record Looks Like
Here’s the strategic part, and it comes from the regulator’s own side of the fence.
The WA Auditor General’s review of compliance with mining environmental conditions found that operator-reported ground disturbance isn’t adequately verified against independent information, and recommended the department check it using independent sources such as publicly available imagery. Read that again from where you’re sitting as an operator. The regulator has told itself, in writing, that self-reported area needs independent imagery to verify it. The direction of travel is obvious. The operators who’ll sail through the next decade of audits are the ones whose numbers already come with that independent backing attached.
So what does a defensible disturbance record look like in practice? Three components, and satellite imagery supplies all three from the same source:
- Dated imagery of the tenement at or near your assessment date, from an external provider with a verifiable timestamp.
- Georeferenced polygons of the disturbance, classified by type, with the hectares that went into each MRF category.
- A consistent, documented method, so this year’s figure was produced the same way as last year’s and can be re-run by someone else.
Keep that package and your annual return stops being an assertion and becomes evidence. Records have to be retained for at least two years anyway, and assessments can be reopened for up to two years after lodgement, so having the imagery on file isn’t busywork. It’s the thing that closes the audit in an afternoon instead of a fortnight.
Getting MRF-Ready Imagery Without the Headache
The reason most teams don’t already measure this way isn’t the satellites. It’s everything between the raw capture and a number you can defend. Two captures of the same pit a year apart have to line up to the metre before you can trust the area difference between them, which means orthorectifying both so coordinates match and processing them consistently so a brighter, hazier day doesn’t masquerade as new disturbance. Skip that and your “change” is half measurement noise. We do that alignment and correction on every order, included in the base price rather than billed as an extra, so the imagery arrives analysis-ready and two years’ captures are genuinely comparable.
Through one platform you can pull free Sentinel-2 and Landsat for the broad footprint and task sub-metre captures over the boundaries that need to be exact, across operators like Beijing-3, Jilin-1 and SuperView, all delivered processed to a consistent standard. That’s the difference between imagery you have to caveat and imagery you can staple to a due diligence file.
If you’re working out the imagery layer for your next MRF return, start with what’s available on our satellite imagery page, or tell us about your tenements and we’ll work out which can ride on free Sentinel-2 and which need a tasked capture to pin the boundary. The levy is priced by the hectare. The hectare’s worth measuring properly.
Frequently Asked Questions
How is the mining rehabilitation fund levy calculated?
The MRF levy is 1% of a tenement’s Rehabilitation Liability Estimate (RLE). The RLE is your disturbed area in each category multiplied by that category’s per-hectare unit rate (roughly $2,000 to $50,000/ha), summed across all categories. If the RLE is $50,000 or less, no levy is payable, but you still report.
What is considered ground disturbance for MRF reporting?
Ground disturbance is any land cleared or altered by mining activity: open pits and voids, waste dumps, tailings and stockpiles, plant and infrastructure, haul roads and tracks, laydown areas, and exploration disturbance. It’s reported cumulatively in hectares per category, including land currently under rehabilitation, until it’s signed off as fully rehabilitated.
Does DMPE check my reported disturbed area?
Not when you lodge it. DMPE accepts your self-reported figures, then audits a sample each year against the evidence you’re required to keep. The WA Auditor General has recommended verifying operator-reported disturbance using independent imagery, so expect that scrutiny to grow, not shrink.
Can satellite imagery measure disturbed area accurately enough for MRF reporting?
Yes. Sub-metre satellite imagery resolves disturbance boundaries down to about 0.1 hectare, and mine-disturbance classification studies report accuracies above 90%. Free 10-metre Sentinel-2 handles the broad footprint; tasked sub-metre imagery pins the exact edges. The result is a dated, georeferenced, repeatable area figure.
How can I reduce my MRF levy?
Accurately, by clearing overstated or stale disturbance off your return, and by reclassifying rehabilitated land. Moving area from an active category into “land under rehabilitation” drops its rate to about $2,000/ha, and fully rehabilitated land leaves the return entirely. Both require measured evidence of the change to claim and defend.
Related Articles
Satellite Imagery Across the Entire Mining Lifecycle
How satellite imagery supports mining from exploration through operations to rehabilitation and closure.
Satellite Change Detection: How to Track Change Over Time
The method underneath annual MRF reporting: comparing imagery of the same site across dates to measure what changed.