Strait of Hormuz Satellite Imagery: Tracking Ships Gone Dark
What satellite imagery of the Strait of Hormuz shows during the 2026 crisis: dark tankers, jammed GPS, and how to order the data yourself.
Summary
- Iran closed the Strait of Hormuz to most commercial shipping on 28 February 2026. By midnight on 2 March, not one tanker inside the strait was broadcasting an AIS position
- Maritime intelligence firm Windward counted 167 commercial-size vessels in the strait area on 5 May, with 146 of them running dark, after dark-ship activity jumped nearly 600% in a fortnight
- GPS jamming corrupted navigation for roughly 470 vessels near Fujairah and Khor Fakkan in a single 24-hour window, so even ships trying to be honest were reporting wrong positions
- Satellite imagery records ships whether they broadcast or not. A 330 m supertanker is visible in free 10 m Sentinel-2 data and in forensic detail at 30 cm
- Archive imagery of the strait can be ordered through Pera Portal with published per-km² pricing. New tasking carries operator restrictions that change weekly, so check with us for the current state
At one minute past midnight on 2 March 2026, the Strait of Hormuz disappeared from every ship-tracking website on the internet.
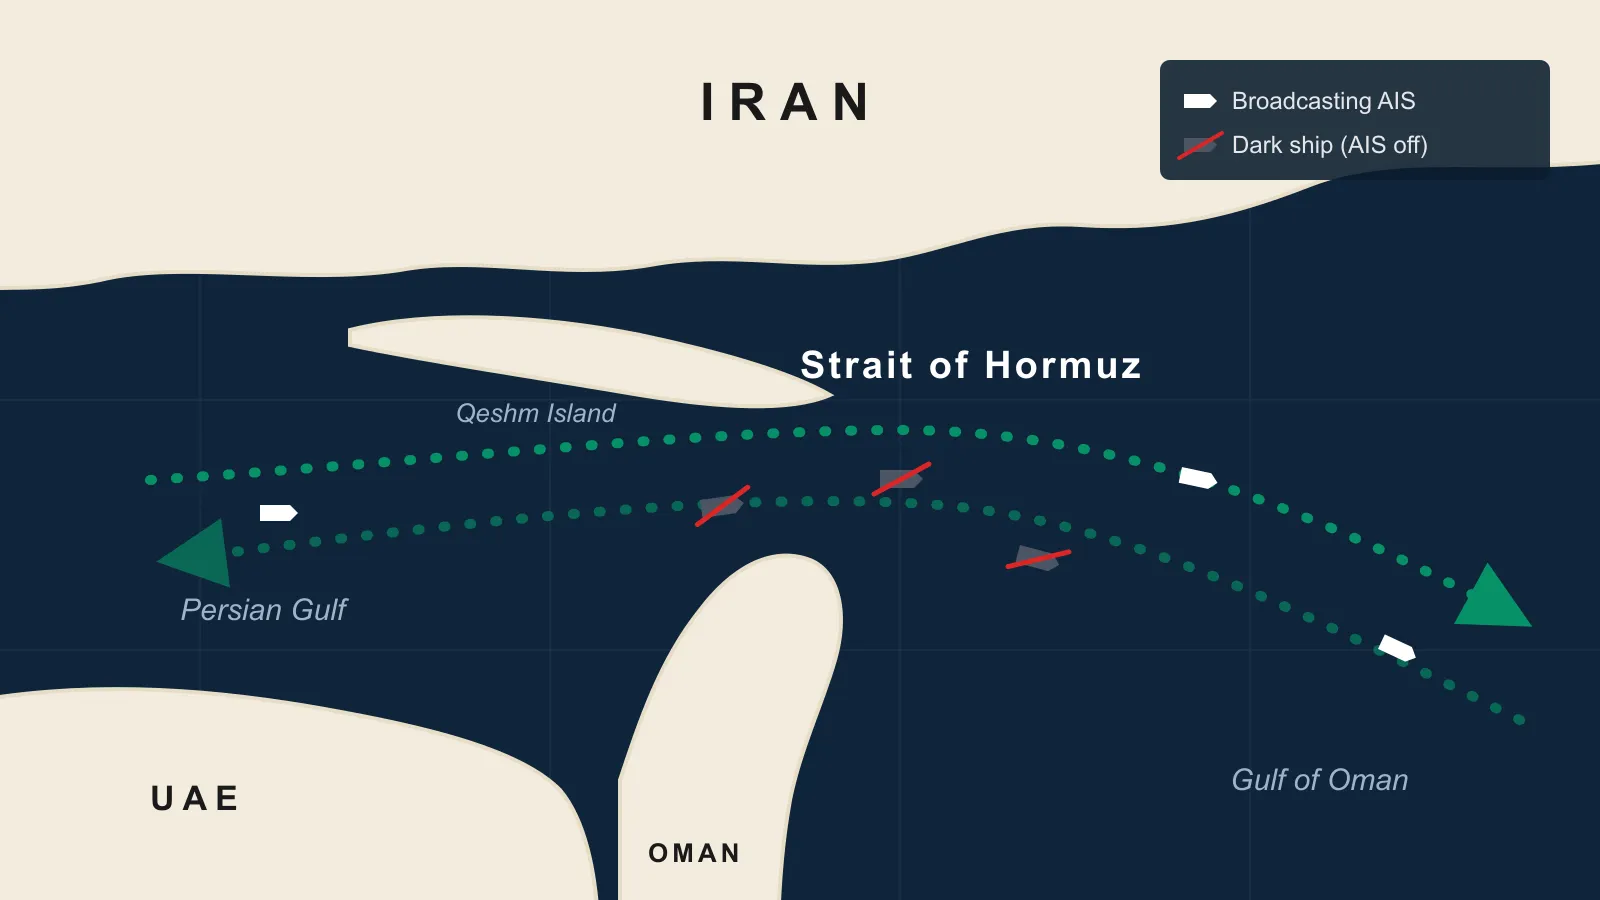
The ships were still there. Dozens of tankers, anchored or creeping along the Omani side of the channel. What vanished was the signal: for the first time since transponders became mandatory, no tanker in the world’s most important oil chokepoint was broadcasting its position.
Since then, satellite imagery of the Strait of Hormuz has become the only reliable way to know what’s actually happening there. The tracking apps show an empty sea and the official statements contradict each other, so everyone from oil traders to war insurers now depends on photographs, taken from 500 km up, of ships that would very much prefer not to be photographed.
This post covers what that imagery shows, why the usual tracking tools broke, and, because we get asked this a lot, how an insurer, trader or researcher orders the same data without a defence budget.
How the World’s Biggest Oil Chokepoint Went Dark
Quick recap for anyone who’s been living under a rock (a reasonable place to be in 2026).
On 28 February, the United States and Israel opened an air campaign against Iran. Iran answered by closing the Strait of Hormuz, the 39 km-wide channel between Iran and Oman’s Musandam Peninsula that carries roughly 20 million barrels of oil every day. The US Energy Information Administration calls it the world’s most important oil transit chokepoint, handling about a quarter of seaborne oil trade and a fifth of global LNG.
The market did what markets do. Brent crude cleared US$100 a barrel by 8 March and peaked at US$126. War-risk insurance premiums for a single transit jumped from 0.125% of hull value to as much as 0.4%, adding around US$250,000 per voyage for a large tanker. By late April, some 2,000 ships and 20,000 mariners were stuck waiting on either side of the blockade.
Ceasefires have come and gone since. The latest one frayed in early July, and by mid-month Iran had struck seven commercial vessels in a week. Transits collapsed from about eight supertanker crossings a day in late June to roughly two.
Every number in the paragraph above was either confirmed or discovered by someone looking at satellite imagery.
AIS Was Never Built for This
Every commercial vessel over 300 gross tonnes carries an AIS transponder, a radio that shouts the ship’s identity, position, course and speed to anyone listening. Ship-tracking websites are, at heart, giant AIS receivers. The whole system rests on one assumption: that ships want to be seen.
That assumption is now doing a lot of heavy lifting.
A “dark ship” is simply a vessel that has switched its transponder off, and the Strait of Hormuz is currently the dark shipping capital of the world. Windward measured a near-600% surge in dark activity between 19 April and 3 May. By 5 May, of 167 commercial-size vessels its analysts could identify across the strait, 146 were operating dark. Bloomberg’s reporting in July found tankers going dark for the Hormuz run itself, then reappearing on AIS once safely into the Gulf of Oman.
It gets worse. Ships that leave their transponders on aren’t necessarily telling the truth either, because GPS jamming and GNSS spoofing around the strait have corrupted the position data itself. Roughly 470 vessels near Fujairah and Khor Fakkan reported garbled or impossible positions inside one 24-hour window. Tankers have appeared to teleport inland, or sail in circles over an airport.
What Satellite Imagery of the Strait of Hormuz Actually Shows
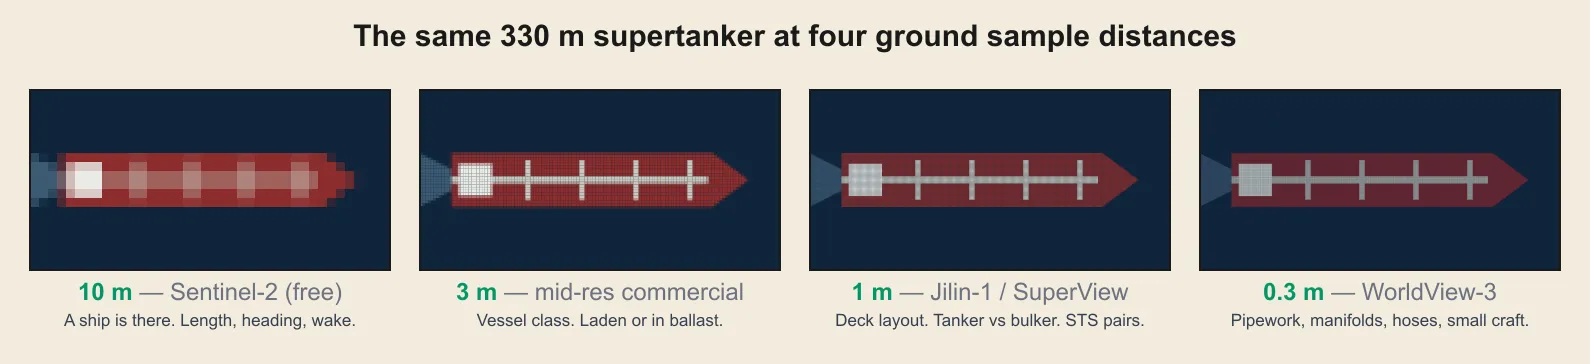
Optical satellite imagery works on a different principle from AIS: it doesn’t ask, it looks. And what you can pull out of a scene depends almost entirely on resolution.
| Resolution | Example source | A 330 m tanker spans | What you can determine |
|---|---|---|---|
| 10 m | Sentinel-2 (free) | ~33 pixels | A ship is present. Length class, heading, whether it’s under way |
| 0.5–0.75 m | Perascope, SuperView | ~450–660 pixels | Vessel type, deck layout, two hulls rafted together for an STS transfer |
| 0.3–0.5 m | WorldView-3, Beijing-3 | ~660–1,100 pixels | Deck pipework, manifolds, whether hoses are connected, individual fast craft |
A few things practitioners have been reading out of Hormuz imagery this month:
Anchorage counting. On 19 July, analysts identified 14 tankers holding at Iran’s Kharg Island export terminal, 13 of them dark, with a combined capacity in the range of 16-18 million barrels. You can’t hide a parked fleet.
Ship-to-ship transfers. Two tankers rafted hull-to-hull off the Omani coast are unmistakable at sub-metre resolution. Imagery from 18 July showed exactly one STS pair still working outside the strait, down from several the week before, which told oil analysts the transfer trade was stalling days before any official data could.
Small craft swarms. Around 85 high-speed craft were imaged moving through the strait in three groups in mid-July, the largest small-boat presence ever recorded there. Boats that size have no AIS at all. Imagery is the only way they get counted.
One honest caveat, because this is the bit breathless LinkedIn posts get wrong: you will not read a ship’s name off its stern from orbit. Identification at 30 cm comes from measuring length and beam, matching deck fittings, and tracking a hull between passes. It’s fingerprinting, not name-reading. That’s also why change detection matters more than any single image: the story is in what moved between Tuesday and Friday.
The Gulf Is Almost Cloud-Free, Which Changes the Maths
Maritime surveillance talk usually jumps straight to radar satellites, because most of the world’s shipping lanes spend half the year under cloud. Radar has real advantages here, and we’ve written a full explainer on how SAR satellites see through weather and darkness. ESA’s free Sentinel-1 C-band radar covers the Gulf routinely.
But the Strait of Hormuz is a special case. This is one of the least cloudy stretches of ocean on the planet. For most of the year, an optical satellite pass over the strait simply works, which is why so much of the public reporting on this crisis is built on ordinary photographs rather than radar.
Haze and airborne dust are the real problem in the Gulf, and they flatten contrast and shift colour across a scene in a way cloud never gets the chance to. That’s an atmospheric correction problem, and it’s solvable in processing. We’ve covered why atmospheric correction matters in detail, but the short version: corrected imagery keeps a grey hull separable from a grey sea on a hazy June afternoon, and uncorrected imagery sometimes doesn’t.
Revisit is the other half of the equation. Sentinel-2 photographs the strait about every five days at 10 m, free, and it’s a genuinely useful screening layer. Free satellite data sources will get you surprisingly far. When five days isn’t enough, or 10 m pixels aren’t, you task a high-resolution satellite to capture the area on demand. Our guide to how satellite tasking works walks through the mechanics.
Who’s Buying Imagery of a Chokepoint
Navies and intelligence agencies have their own satellites. The interesting shift in 2026 is who else is ordering commercial imagery of Hormuz, because the buyer list looks nothing like it did five years ago.
Insurers and P&I clubs are verifying where a vessel actually was before paying a war-risk claim, since the ship’s own AIS log is now worth roughly nothing as evidence.
Commodity traders and analysts count tankers at Kharg Island and STS pairs off Oman to estimate export volumes days ahead of official figures. When Brent moves double digits on a rumour, one clear image of an anchorage is cheap.
Charterers and supply chain teams want independent confirmation that a nominated vessel is where its owner says it is, and that its recent track doesn’t include a quiet detour to a sanctioned port.
Journalists and researchers have used commercial imagery all year to verify strikes, sinkings and blockade claims that no reporter can reach by boat.
None of these organisations owns a satellite. All of them can order from the same constellations, which is the part of this industry that still feels slightly like science fiction.
Watching the Strait Without a Navy
A word on what Geopera actually does, since “just buy satellite imagery” has historically been easier said than done.
Through Pera Portal, you can search archive imagery over any area, the Hormuz shipping lanes and anchorages included, or task a new capture from constellations run by multiple operators: WorldView at 30 cm, Beijing-3, Perascope, SuperView, and Wyvern’s hyperspectral sensors, which pick up things like oil slicks that broadband colour imagery misses. Multi-operator access matters more in a crisis than any other time. And fair warning: there are real restrictions on Hormuz imagery right now. Some operators have limited tasking over parts of the Gulf, others hold back recent captures from general sale, and the rules shift week to week as the situation does. We work with the operators directly, so we know the current state of play at any given moment. Reach out before you plan a capture and we’ll tell you what can and can’t be ordered over the strait this week, rather than letting you find out after you’ve budgeted for it.
Every order arrives orthorectified, pansharpened and atmospherically corrected at no extra cost, which for maritime work means positions you can measure from and haze you don’t have to fight. Most of the industry charges 30-80% extra for that processing or skips it entirely.
Pricing is published on our pricing page by resolution tier, per square kilometre, so you can cost a monitoring cadence over an anchorage before speaking to a human. And if you’re not sure whether free Sentinel-2 screening covers your use case, ask us. Sometimes the free answer is the right one, and we’ll say so.
The strait will reopen eventually, chokepoints always do. What won’t reverse is the habit organisations picked up this year of checking what’s actually on the water instead of trusting what ships say about themselves.
Frequently Asked Questions
Can satellite imagery track ships that have turned off AIS?
Yes. AIS is a self-reported radio broadcast; satellite imagery physically photographs the vessel. A 330 m tanker is detectable in free 10 m Sentinel-2 data and identifiable by length, beam and deck layout in 30-50 cm commercial imagery, transponder or not.
Is the Strait of Hormuz still closed to shipping in July 2026?
Effectively, yes, for most commercial traffic. After the early-July truce broke down, Iran struck seven vessels in a week and transits fell to roughly two supertankers per day, against a pre-crisis norm of well over a dozen. Conditions change weekly, so verify before planning anything.
What resolution do you need to identify a ship in satellite imagery?
Detection needs surprisingly little: 10 m data shows presence, heading and length class. Classification (tanker vs bulker, ship-to-ship pairs) needs sub-metre imagery. Fingerprinting a specific hull uses 30-50 cm data and repeat passes. No commercial resolution reads a ship’s name.
How often can satellites capture the Strait of Hormuz?
Sentinel-2 images the strait free about every five days at 10 m. Commercial high-resolution constellations like Perascope, Beijing-3 and WorldView can be tasked for far more frequent captures, and the Gulf’s near-permanent clear skies mean optical passes rarely fail.
Can anyone buy satellite imagery of the Strait of Hormuz?
Mostly, yes. Archive scenes are available to businesses, researchers and individuals through platforms like Pera Portal, priced per square kilometre by resolution tier. New tasking over the strait currently carries operator-specific restrictions that change frequently, so check the current rules with a provider first.