What is Pansharpening in Satellite Imagery?
Pansharpening fuses high-res panchromatic and lower-res multispectral satellite bands into one sharp colour image. How it works, when to use it, and the trade-offs.
Summary
- Pansharpening is an image fusion technique that combines a high-resolution panchromatic (black-and-white) band with lower-resolution multispectral (colour) bands to produce a single sharp, full-colour image.
- The spatial resolution improvement is typically 4x. A satellite like WorldView-3 captures 0.31m panchromatic and 1.24m multispectral. Pansharpening gives you 0.31m colour imagery.
- The trade-off is spectral fidelity. Pansharpened images look better, but the fusion process alters the original spectral values. Running NDVI or other quantitative analyses on pansharpened data can produce unreliable results.
- Most satellite imagery providers charge extra for pansharpening as a processing add-on, typically 30-80% on top of the base imagery price. Geopera includes it in every order at no additional cost.
- You should almost always request pansharpened imagery for visual interpretation, mapping, and feature extraction. Skip it only when you need the raw spectral values for quantitative analysis.
Why do satellites still take black-and-white photos? It’s 2026. We’ve got phones that shoot 200-megapixel colour photos. Surely a billion-dollar satellite can manage colour at full resolution.
It can’t. And the reason is physics, not budget.
A satellite sensor has to make a choice. It can collect all visible light into one wide band and produce a sharp, detailed greyscale image. Or it can split that light into separate colour channels and get a colour image, but at lower resolution because each channel gets less light. You can’t have full spatial detail and full colour at the same time. Not from a single sensor pass.
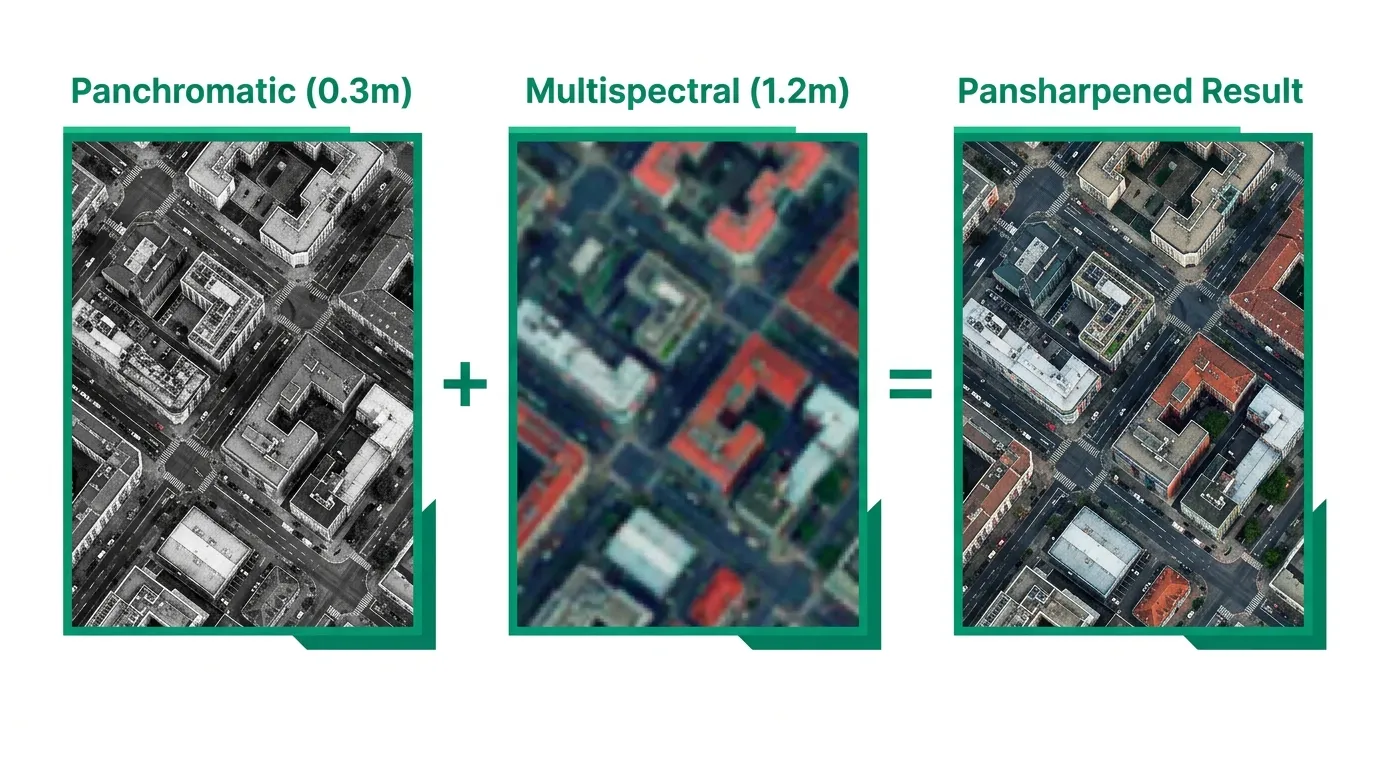
Pansharpening is the workaround. It takes the sharp black-and-white image (the panchromatic band) and the blurry colour image (the multispectral bands) and fuses them into one product: a sharp colour image at the panchromatic resolution. If you’ve ever looked at commercial satellite imagery and thought “that’s impressively detailed for a colour photo taken from 600km up,” you were probably looking at a pansharpened image.
What is a Panchromatic Image?
A panchromatic image is a single-band greyscale image that captures light across a wide range of the visible spectrum, roughly 450-900nm. “Pan” means all, “chromatic” means colour. The sensor collects all visible wavelengths into one bucket instead of separating them into red, green, and blue.
The advantage is simple: more photons per pixel. Because the sensor isn’t splitting light into separate channels, each detector element receives more energy, which means you can make the pixels smaller while still getting a clean signal. That’s why panchromatic bands consistently deliver the highest spatial resolution on any given satellite.
On WorldView-3, the panchromatic band captures at 0.31m resolution. The multispectral bands on the same satellite? 1.24m. Four times coarser. Same satellite, same orbit, same moment in time. The only difference is how the sensor divides the incoming light.
This 4:1 ratio isn’t arbitrary. It shows up across nearly every commercial optical satellite:
| Satellite | Panchromatic Resolution | Multispectral Resolution | Ratio |
|---|---|---|---|
| WorldView-3 (Vantor) | 0.31m | 1.24m | 4:1 |
| Beijing-3 (21AT) | 0.5m | 2.0m | 4:1 |
| SuperView (SpaceWill) | 0.5m | 2.0m | 4:1 |
| Jilin-1 (CGSTL) | 0.75m | 3.0m | 4:1 |
| WorldView-2 (Vantor) | 0.46m | 1.84m | 4:1 |
| KOMPSAT-3A (KARI) | 0.55m | 2.2m | 4:1 |
| Pleiades Neo (Airbus) | 0.3m | 1.2m | 4:1 |
The 4:1 ratio is baked into the sensor hardware. Each panchromatic detector element is one quarter the size of each multispectral detector element, collecting the same total amount of light because it doesn’t need to split it by wavelength.
How Pansharpening Works
The concept is simple. You have two images of the same area captured at the same time:
- Panchromatic: sharp spatial detail, no colour information
- Multispectral: colour information, fuzzy spatial detail
Pansharpening extracts the spatial detail from the panchromatic band and injects it into the multispectral bands, producing colour imagery at the panchromatic resolution.
The actual fusion happens through one of several algorithms. The most common ones in commercial satellite processing:
IHS (Intensity-Hue-Saturation) transforms the multispectral bands from RGB colour space into IHS colour space, replaces the Intensity component with the panchromatic band, then transforms back. Fast and produces visually sharp results, but tends to distort colours.
Brovey Transform normalises each multispectral band by the sum of all bands, then multiplies by the panchromatic band. Computationally simple. Good colour preservation for natural colour composites, but again shifts spectral values.
Gram-Schmidt simulates a lower-resolution panchromatic band from the multispectral data, then uses the difference between the simulated and real panchromatic bands to sharpen the multispectral image. Generally produces the best balance of spatial sharpness and colour fidelity, as NASA’s Earth Observatory has documented. This is the default in most commercial processing pipelines, including ours at Geopera.
HPF (High-Pass Filter) extracts high-frequency spatial detail from the panchromatic band using a filter, then adds that detail to each upsampled multispectral band. Simple and effective, with reasonable spectral preservation.
No algorithm is perfect. They all involve a compromise between spatial sharpness and spectral accuracy. But for the majority of commercial use cases, the visual improvement massively outweighs the spectral trade-off.
The Spectral Integrity Trade-off
This is the part that matters if you’re doing anything quantitative with satellite data.
Pansharpening changes pixel values. The fusion process alters the original digital numbers recorded by the multispectral sensor. The degree of alteration depends on the algorithm, the scene content, and how well the panchromatic band’s spectral range overlaps with the multispectral bands.
What does that mean in practice? If you calculate NDVI from pansharpened imagery, the values won’t exactly match NDVI calculated from the original multispectral bands. For some algorithms, the difference is small. For others, it can be significant enough to misclassify vegetation health categories.
Rule of thumb:
- Visual interpretation, mapping, digitising features, presentations = use pansharpened. The improved spatial detail makes everything easier to see and interpret.
- Quantitative spectral analysis (NDVI, NDWI, classification, change detection) = use the original multispectral bands. Don’t sacrifice spectral accuracy for pixels you don’t need.
- Mixed workflows = request both. Use the pansharpened product for visual reference and feature identification, then run your spectral calculations on the native multispectral data.
Most commercial providers deliver pansharpened imagery as the default product. If you need the raw multispectral bands for analysis, you’ll typically need to specify that when ordering. At Geopera, we can deliver either or both, depending on your workflow.
When Pansharpening Adds Real Value
Not every project needs pansharpened imagery. But most do. Here’s when the 4x resolution boost makes a genuine difference.
Urban mapping and infrastructure monitoring. At 1.2m multispectral resolution, you can see buildings but not their outlines. At 0.3m pansharpened, you can trace individual building footprints, identify road markings, and spot vehicles. The difference between “there’s a structure” and “that’s a two-storey commercial building with rooftop solar panels.”
Defence and security applications. Object identification demands the highest possible spatial resolution combined with colour. Pansharpened WorldView-3 imagery at 0.31m is the standard for intelligence-grade analysis.
Insurance and damage assessment. After natural disasters, adjusters need colour imagery sharp enough to assess roof damage, identify debris fields, and estimate structural impacts. Pansharpened imagery delivers that level of detail.
Mining site monitoring. Tracking stockpile volumes, road conditions, and equipment locations requires colour imagery at sub-metre resolution. Running NDVI for rehabilitation monitoring should use the native multispectral bands, but pansharpened products handle everything else.
Agriculture at field scale. Identifying individual pivot irrigators, checking fence lines, mapping waterways. For crop health analysis, stick with native multispectral. For everything else, pansharpened wins.
When to Skip Pansharpening
There are valid reasons to work with the native multispectral bands instead.
Spectral index calculations. If your primary deliverable is an NDVI map, an NDWI analysis, or any index that relies on precise spectral values, use the original multispectral data. The spectral distortion from pansharpening, even with Gram-Schmidt, introduces noise into your results.
Land cover classification. Supervised and unsupervised classification algorithms train on spectral signatures. Altered signatures from pansharpening can reduce classification accuracy, sometimes by several percentage points. Train and classify on native multispectral, then overlay results on pansharpened imagery for presentation if needed.
Time-series analysis. If you’re comparing imagery across multiple dates to detect change, consistency matters more than resolution. Using pansharpened imagery from different dates, potentially processed with different algorithms or parameters, introduces variables that have nothing to do with actual ground change.
Large-area mapping at coarse resolution. If you’re mapping land cover across a 10,000 km² region using Sentinel-2 at 10m resolution, pansharpening won’t help. Sentinel-2 doesn’t even have a panchromatic band.
What This Means When You’re Buying Satellite Imagery
Here’s the thing most buyers don’t realise until after they’ve placed an order: pansharpening is usually a paid add-on.
Most satellite imagery providers sell you the raw or semi-processed data, then charge extra for processing steps like orthorectification, atmospheric correction, and pansharpening. These fees can add 30-80% to the base imagery cost. You order a 50 km² area at $12/km², expecting to pay $600, and the invoice comes back at $900-$1,080 because processing was extra.
We think that’s backwards. At Geopera, pansharpening is included in every order as part of our standard processing pipeline. So is orthorectification and atmospheric correction. You get analysis-ready, pansharpened colour imagery at the full panchromatic resolution without paying more for it. That’s how buying satellite imagery should work.
If you need the native multispectral bands alongside the pansharpened product, we deliver those too. Same order, no surcharge. See how our satellite imagery processing pipeline handles pansharpening, orthorectification, and atmospheric correction as standard on every order.
Frequently Asked Questions
What is pansharpening in satellite imagery?
Pansharpening is an image fusion technique that merges a high-resolution panchromatic (greyscale) satellite band with lower-resolution multispectral (colour) bands to create a single colour image at the higher panchromatic resolution. The process typically improves spatial resolution by 4x while preserving the colour information from the multispectral bands.
What is a panchromatic image?
A panchromatic image is a single-band greyscale image that captures all visible wavelengths (roughly 450-900nm) into one channel. Because the sensor collects more total light per pixel compared to splitting it into colour channels, panchromatic bands achieve the highest spatial resolution available from any given satellite. For example, WorldView-3 captures 0.31m panchromatic vs 1.24m multispectral.
Does pansharpening affect spectral accuracy?
Yes. All pansharpening algorithms alter the original spectral values to some degree. For visual interpretation and mapping, this is acceptable. For quantitative analysis like NDVI calculation, land cover classification, or change detection, you should use the original multispectral bands to preserve spectral fidelity. The Gram-Schmidt method generally produces the least spectral distortion.
Which pansharpening algorithm is best?
Gram-Schmidt spectral sharpening is considered the best general-purpose algorithm, offering the strongest balance between spatial sharpness and spectral preservation. IHS fusion produces sharp results but distorts colours more. Brovey Transform works well for visual products. The optimal choice depends on whether your priority is visual quality or spectral accuracy.
Can you pansharpen Sentinel-2 data?
Sentinel-2 does not have a panchromatic band, so traditional pansharpening isn’t possible. However, Sentinel-2’s 10m visible bands (B2, B3, B4, B8) can be used to sharpen the 20m bands (red edge, SWIR) using similar fusion techniques, as described in the ESA Sentinel-2 technical guide. Some researchers also apply super-resolution methods to enhance Sentinel-2 spatial detail, though these aren’t true pansharpening.
Related Articles
Multispectral vs Hyperspectral Satellite Imagery Explained
What changes when a satellite captures 200 bands instead of 4? Resolution trade-offs, costs, and which type fits your project.

What You Should Know About Optical Satellite Imagery
How optical satellite imagery works, from spectral bands to spatial resolution, plus practical applications across industries.