Satellite-Derived Bathymetry, Put to the Test Against Laser Truth
Geopera satellite-derived bathymetry from Sentinel-2 and ICESat-2: seabed depth validated to within 38 cm of NASA's laser in clear water and about a metre against airborne LiDAR in turbid water, with honest uncertainty on every pixel.

Table of Contents
Summary
- Geopera now produces satellite-derived bathymetry (SDB) — seabed depth maps made from satellite imagery, with no boats, no aircraft, and no in-water survey.
- Over a clear lagoon in the Bahamas, our depths landed within 38 centimetres of NASA’s ICESat-2 laser — 0.38 m across the scene, and sub-half-metre through the shallows. Seabed depth, from orbit, to within a hand’s width of a survey-grade laser — accuracy at the front of the field.
- In turbid, temperate water — the case that defeats most satellite bathymetry at a few metres — we still hold about a metre across the shallows, validated against a real airborne LiDAR survey at Jervis Bay, NSW.
- The edge is the processing. A depth map is only as good as the imagery beneath it, and pulling a clean seabed signal out of Sentinel-2 — through haze, glint and sediment — is exactly the craft Geopera brings to every order. That’s a large part of why our numbers come out where they do.
- Every depth ships with its own honesty: a calibrated error bound on each pixel, a flag for where the seabed stops being visible, and a clear line between what we measured and what we inferred. It complements a hydrographic survey; it doesn’t replace one.
A lagoon in the Bahamas. Water so clear you can read the sand ripples from a plane. We pointed nothing at it — no boat, no survey crew, no aircraft trailing a laser. We just took satellite imagery — refreshed every few days — and, with the same processing we bring to every order, turned it into a map of the seabed.
Then we did the only thing that matters: we checked it against the truth. NASA’s ICESat-2 satellite carries a laser precise enough to find the seabed through clear water. We held a stripe of those laser depths back, predicted them from the imagery alone, and then asked the laser how close we got.
The answer was 38 centimetres.
That’s the gap across the whole scene between what we computed from orbit and what a survey-grade laser measured directly. For seabed depth pulled from a satellite that was never built for the job, in water nobody surveyed for us, that number is the reason we’re writing this post.
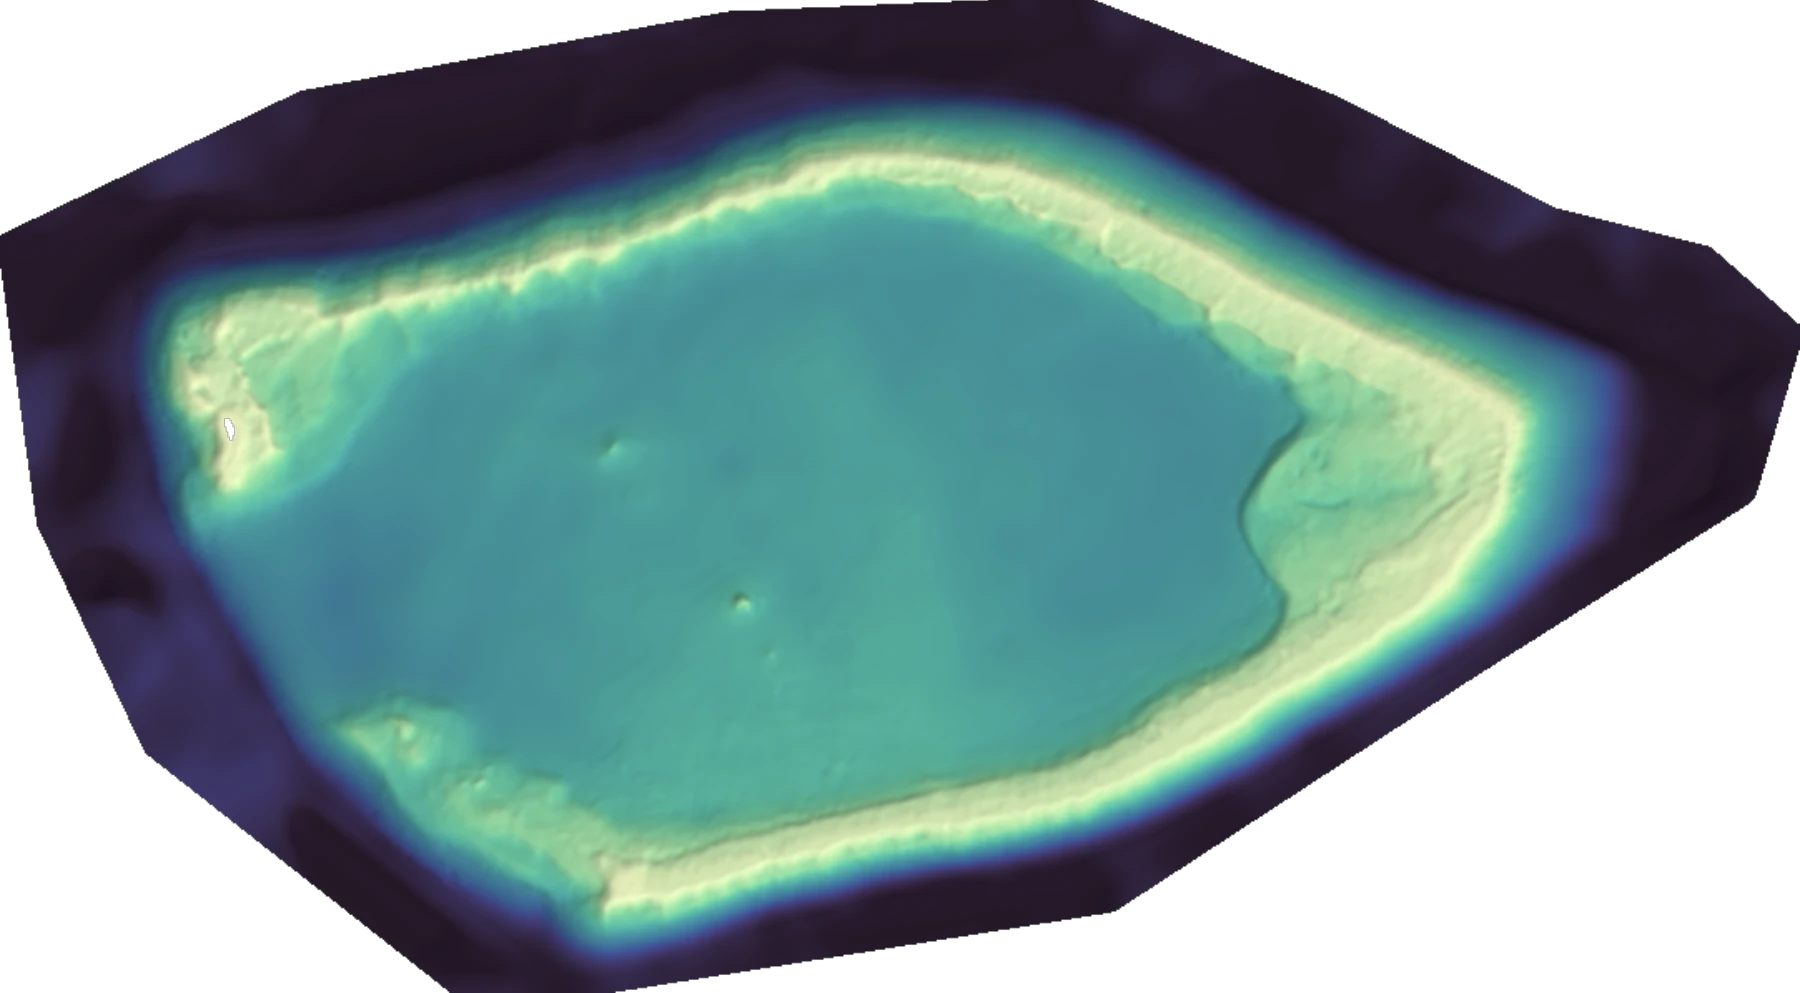
And it isn’t an average hiding a mess. It’s sub-half-metre right through the shallows, where the seabed is brightest and the decisions get made:
From routine satellite imagery, against a laser that costs a fortune to fly. That’s not a reconnaissance sketch. That’s a depth surface you can plan around.
Here’s the catch, and it’s the reason this post keeps going. Clear tropical water is the easy mode of bathymetry. Quote a number like 38 cm and stop there, and you’ve told a true story that happens to be useless to anyone whose coastline isn’t a postcard. Most of the world’s working coast — the harbours, the dredged channels, the estuaries — is green, murky and full of suspended sediment. So before you lean on that figure, we want to show you what happens when the water fights back.
Why the seabed is mostly a mystery
Most of the ocean floor has never been measured. Not the deep stuff — the shallow stuff, the first thirty metres, where ports sit, cables come ashore, reefs grow, fish nurseries hide, and storms rearrange the coast overnight. That shallow margin is the part everyone cares about and almost nobody has mapped, because the only ways to map it properly are slow and expensive.
A survey ship dragging sonar gives you charting-grade truth, to any depth, along the lines the ship actually drove. An aircraft flying LiDAR covers more ground, faster, but only out to where the laser can punch through the water, and only over the corridors you paid it to fly. Both are field campaigns. Both cost real money and real time, and both leave you with depth exactly where you looked and nothing where you didn’t.
Satellites, meanwhile, pass over those same shallow waters every few days, all over the planet. The whole game has always been turning what a satellite sees into a depth you’d actually bet a decision on. That’s the problem we set out to solve, and this is the announcement that we have — with the receipts attached.
How light tells you the depth
Here’s the physics, and it’s the same physics that makes a swimming pool look shallow at one end and bottomless at the other.
When sunlight hits the sea, some of it goes in. It travels down through the water, bounces off the seabed, and comes back up to the satellite. But the water doesn’t let it travel for free. The deeper it goes, the more light gets absorbed on the way down and on the way back — and crucially, different colours get absorbed at different rates. Red light is gone within a few metres. Blue and green reach much deeper before they fade.
So the colour of a patch of shallow sea encodes its depth. A bright sandy bank under two metres of water reads very differently from the same sand under twelve. Read that colour-by-depth signal carefully enough, and you can recover the depth from the imagery alone.
That’s the textbook part, and it’s why the idea isn’t new. The reason satellite bathymetry has spent years stuck with a reputation as a rough reconnaissance trick — fine for a first glance, not for anything you’d stake a survey budget on — is everything else that also changes the colour of a pixel. The haze in the atmosphere. Sun glinting off the surface. The natural brightness of the seabed. And the big one: a cloud of suspended sediment. Get any of those wrong and your “depth map” is really a map of how dirty the water was that morning.
The discipline we already bring to every order — stripping the atmosphere back out of a pixel — matters double here. In a normal image, a bad atmospheric correction is just noise. In bathymetry, it’s a wrong depth.
We think that reputation is a measurement problem, not a law of nature. So instead of arguing about it, we measured — and we picked an unfair place to do it.
The hard case: Jervis Bay
Jervis Bay, on the New South Wales coast, is a deliberately mean test for satellite bathymetry. It’s temperate, turbid and sediment-rich — the kind of water where the simple methods come apart past a handful of metres. If a technique is going to embarrass itself, this is where.
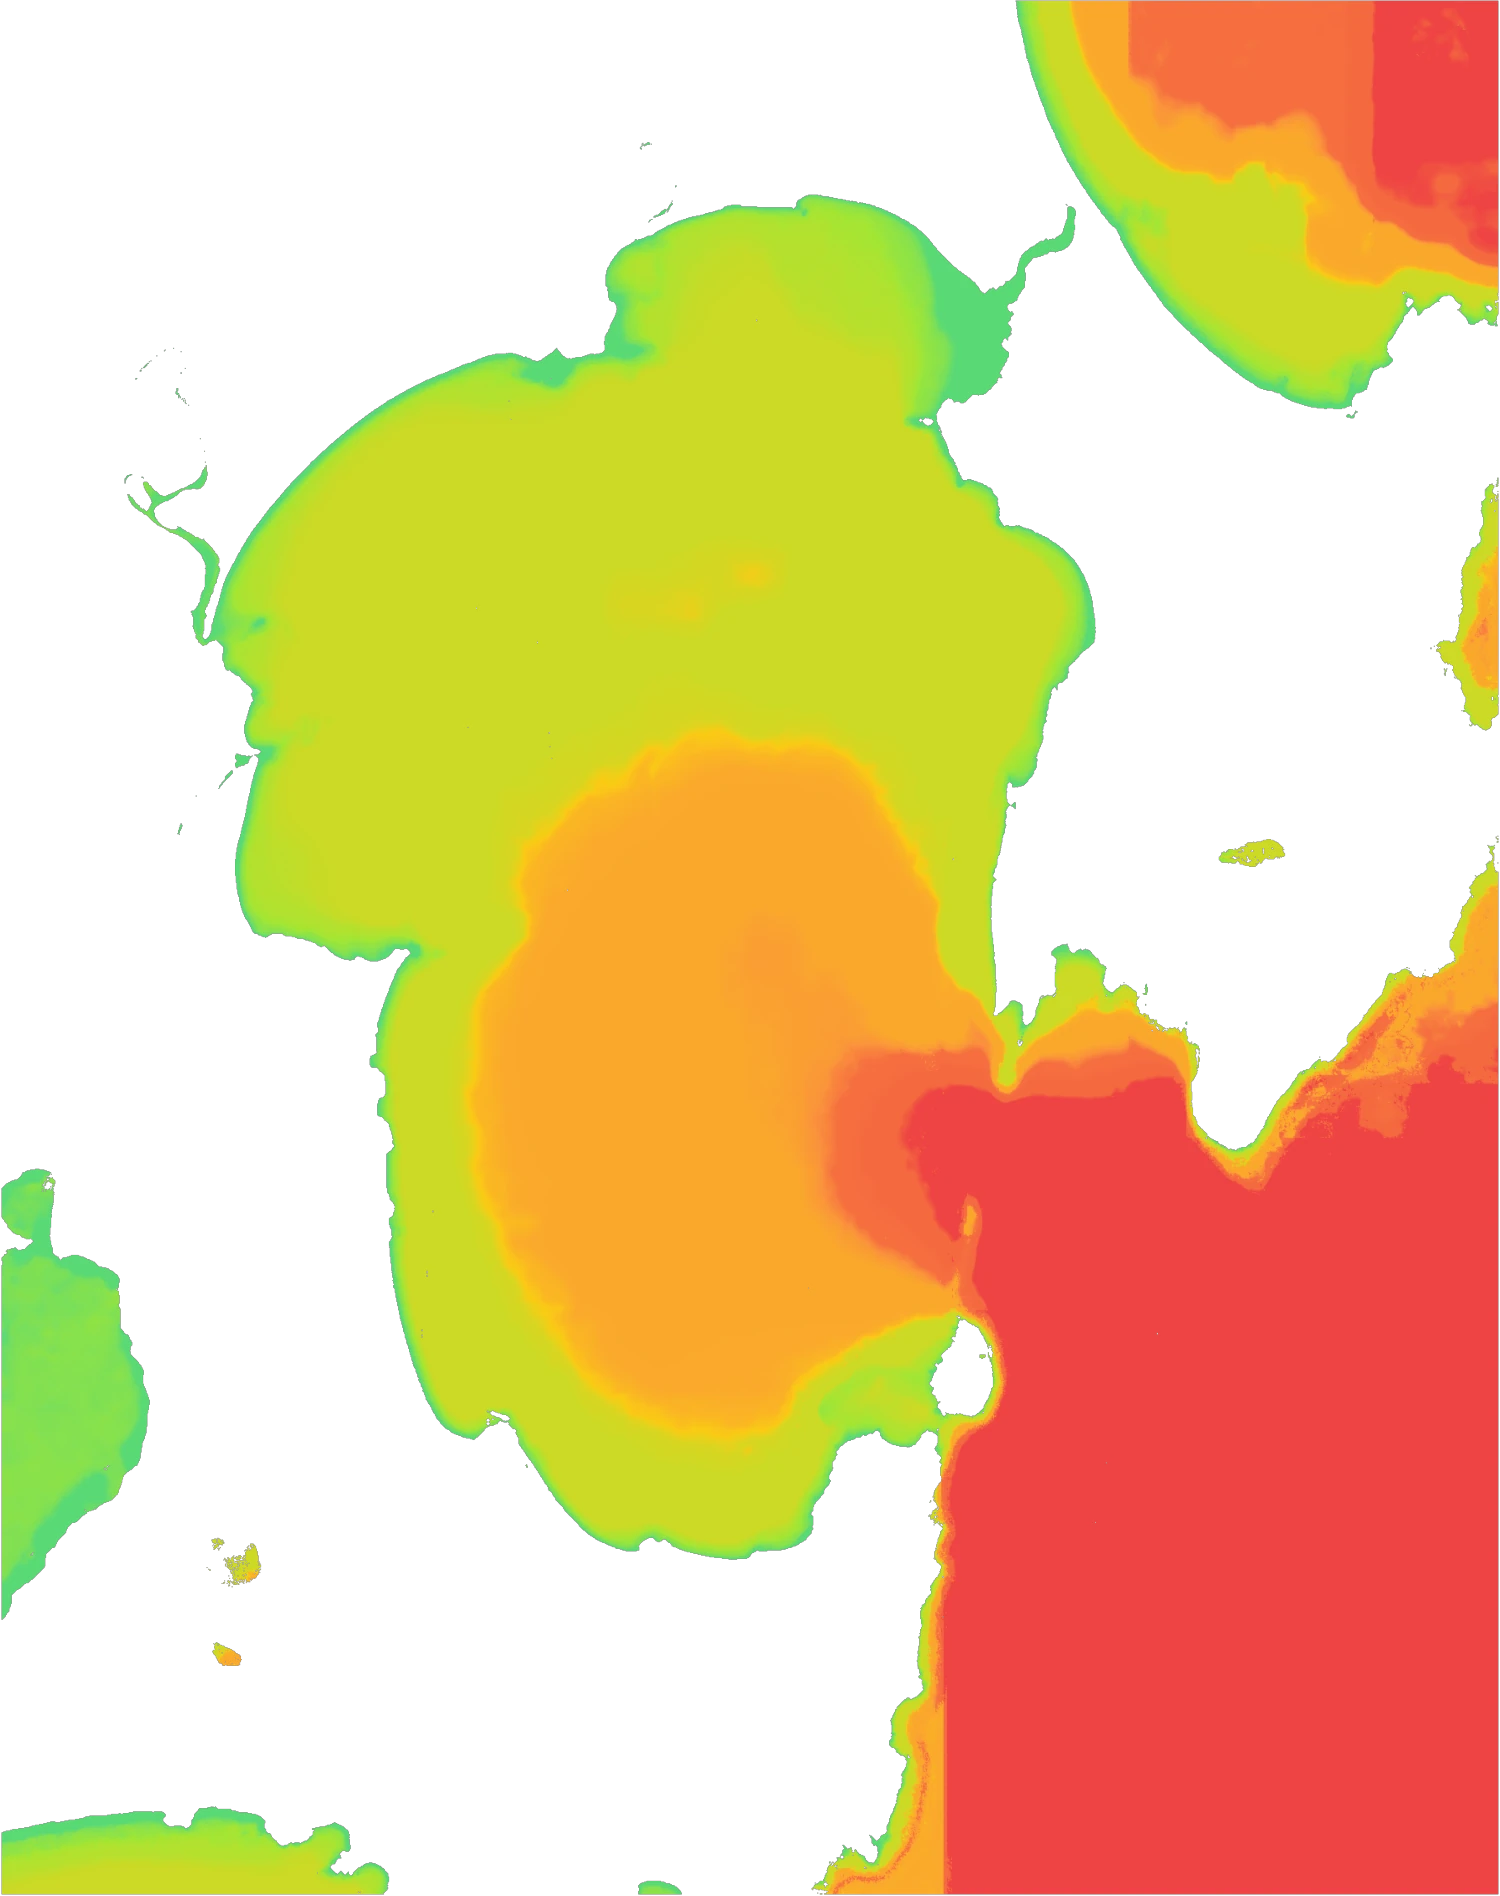
We mapped it from orbit, then laid our result against a dense airborne LiDAR survey of the same seabed, flown by NSW DCCEEW. First, what we computed from a satellite:

Now the reference — what the laser saw, measured directly:
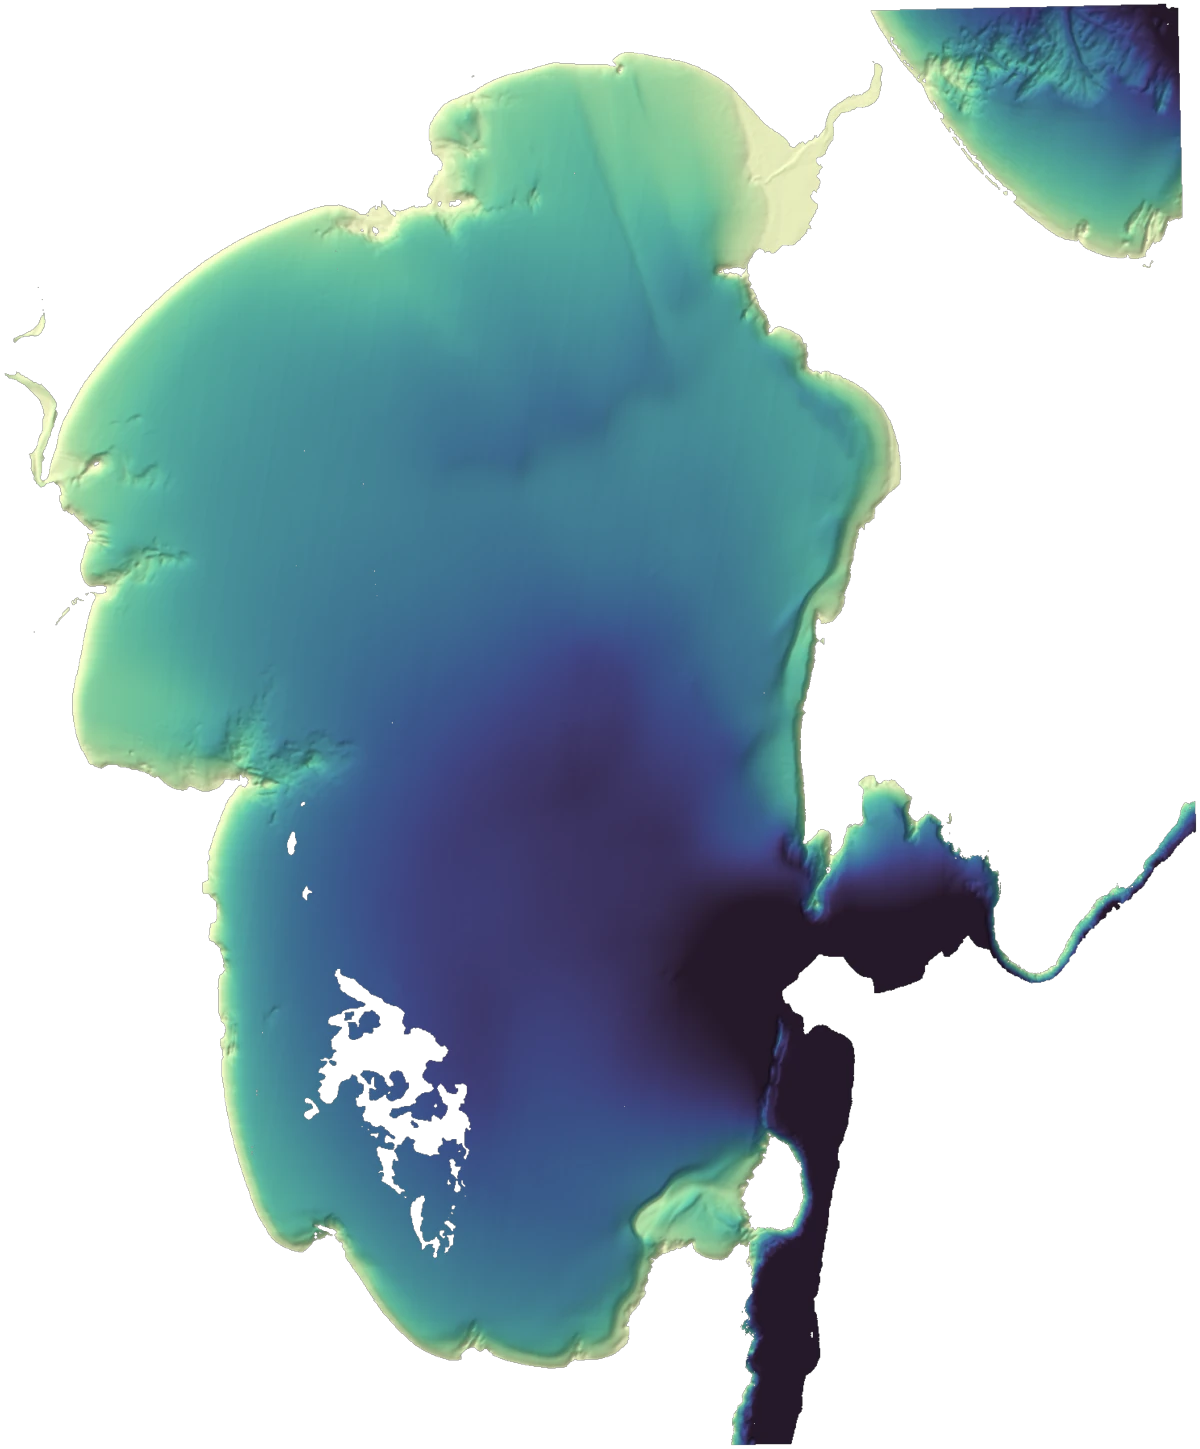
And the honest panel, the difference between the two. Green is where we agree; colour creeps in where we drift apart:
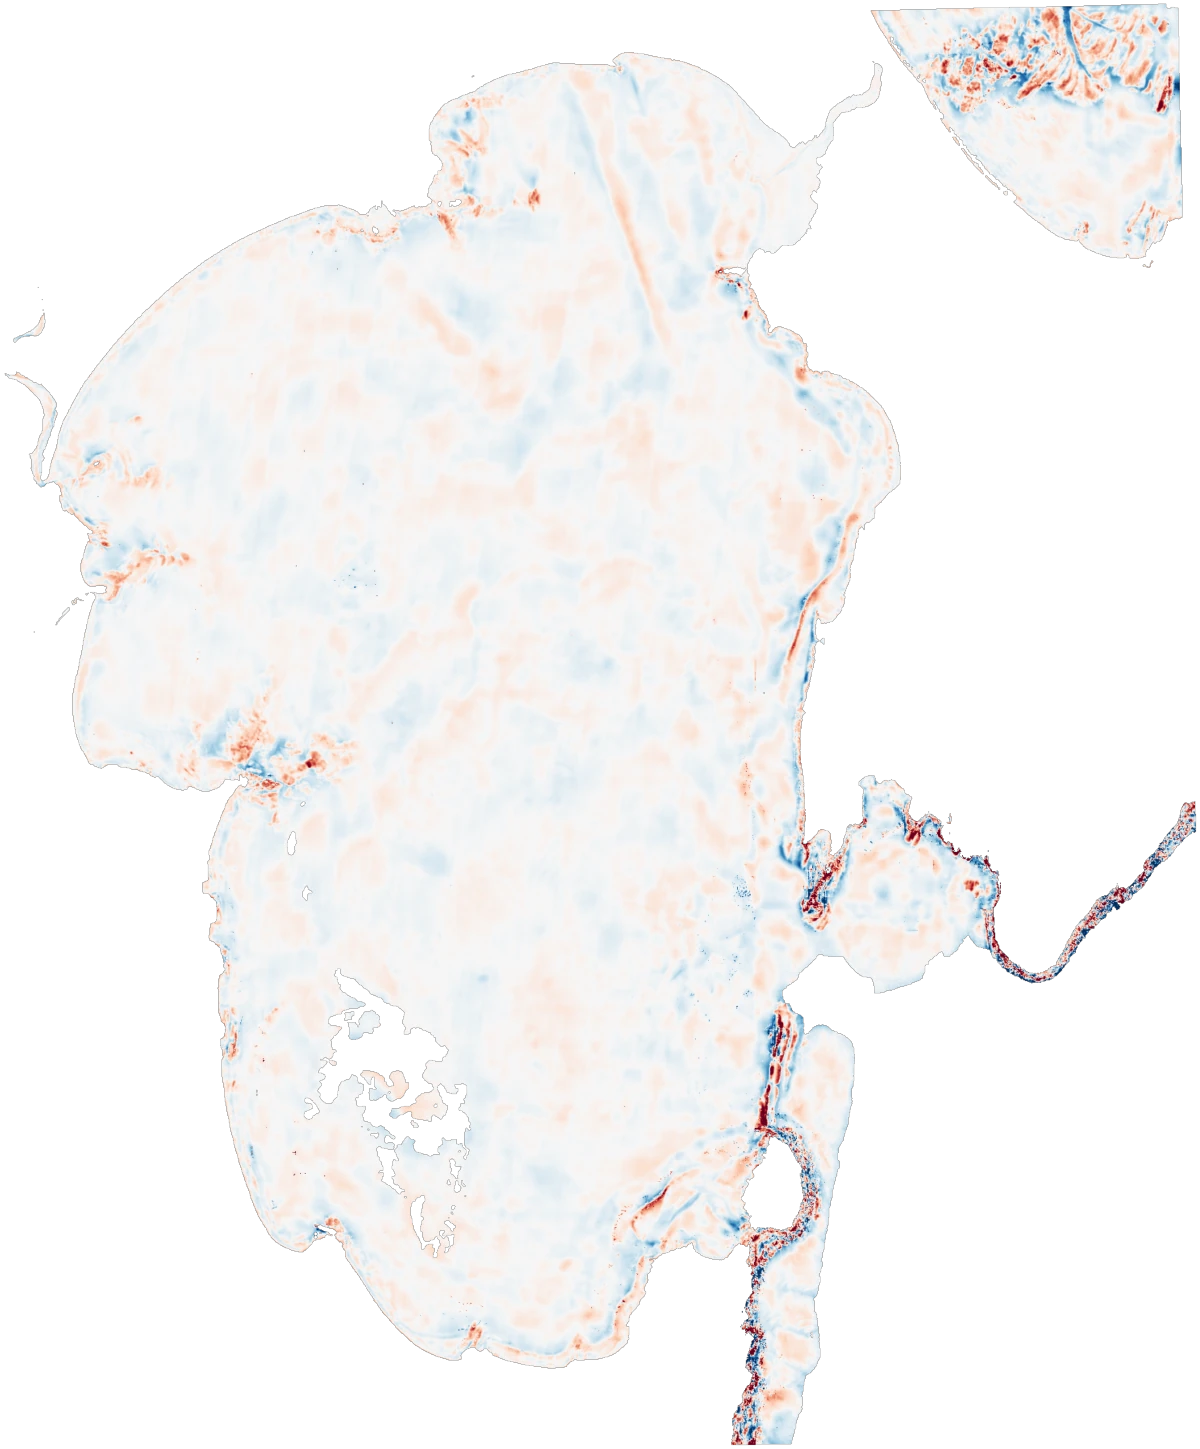
Across the shallow margin — which is most of the bay, and the part that carries the decisions — satellite and laser agree to within about a metre. The colour builds as the water deepens, exactly where the physics says it should, because less light makes it back from down there. So rather than guess in the dark, the product flags where the bottom drops out of sight and leaves it blank. In murky temperate water, at 10-metre resolution, about a metre off a survey-grade laser across the zone that matters is a number we’re happy to put our name on.
And here’s a detail that quietly works in our favour: that LiDAR survey was flown in 2018, while our imagery is from 2026. Some of the colour in the difference map isn’t our error at all — it’s eight years of a real, moving seabed, with sediment shifting and storms reworking the shallows in between. The true gap between our depths and the seabed as it stands today is, if anything, a little tighter than the picture shows.
So how accurate is satellite-derived bathymetry, really?
This is the question every buyer asks, and the honest answer is it depends on your water — which is exactly why a single headline number, ours included, is a little dishonest. Clear water gets you toward 38 centimetres. Murky water gets you toward a metre. And once the water is too deep or too cloudy, the seabed isn’t visible at all.
So instead of stamping one figure across the whole map, every depth we deliver carries its own. Three things travel with each pixel:
- Its own error bound. A calibrated margin on that exact depth — how sure we are right there, not one average smeared across the whole scene.
- A bottom-visibility flag. It marks where the seabed has stopped being optically visible — where the water got too deep or too murky for light to make the round trip — so we never report a depth we can’t actually see.
- A line between measured and inferred. Some of the map is pinned to laser truth; the rest is the model joining the dots. We keep the two clearly marked, so you always know which is which.
This is what lets the product be used like a grown-up, not just admired. You can set a safe working depth, decide which patches still need a boat over them before anyone relies on them, and — for navigation — back up how far you’d trust each area. We’ll happily tell you where our own map shouldn’t be trusted. That’s not a weakness in the product; it is the product.
Why ours is more accurate: the processing underneath
Here’s the part that actually separates one satellite-bathymetry map from another, and it isn’t the satellite.
The raw seabed signal is faint, and almost everything conspires to drown it: haze in the atmosphere, sun glinting off the surface, suspended sediment in the water column. Most providers reach for the same public imagery we do — what they can’t all do is clean it up well enough to leave the real signal standing. That’s the craft Geopera has spent years on. The same processing pipeline behind every order — atmospheric correction, deglinting, careful capture selection — hands the depth model a clean picture to work from. Cleaner inputs are most of the distance between a depth you can trust and a confident-looking guess.
The reference we calibrate against is survey-grade laser truth — the same laser that judged our Bahamas map. We hold some of it back, predict it, and check, so the accuracy you see is earned on data the model never trained on.
That’s also why this is a product, not a giveaway. The imagery is just the raw material. What you pay for is what our processing and calibration turn it into: a depth surface that lands at the front of the field, with an honest error bar on every pixel.
Satellite-derived bathymetry vs LiDAR vs sonar
Satellite-derived bathymetry does not replace a survey ship, and anyone who tells you it does is selling you something. Here’s how the three honestly relate.
Satellite gives you breadth, speed and scale: any sunlit coast on Earth, refreshed every few days, at the lowest cost per square kilometre because there’s no field campaign to mount. Airborne LiDAR gives you project-grade accuracy along the lines you commission. Multibeam sonar gives you charting-grade truth along the ship’s track, to any depth, at the highest cost.
The strongest coastal programmes run all three as a team — satellite to find where to look and to fill the gaps between surveys, LiDAR and sonar to nail down the depths that carry the most risk. That’s the whole reason we validate against LiDAR rather than pretending to beat it. On charting specifically, the international hydrographic community treats satellite-derived bathymetry as a reconnaissance and chart-update source, not a substitute for a proper survey — and we agree. In clear, shallow water our uncertainty is good enough to stand behind a respectable charting confidence tier; in turbid water we’ll tell you it’s a notch lower. We will never claim a confidence level the data hasn’t earned.
Where this is actually useful
- Coastal engineering and dredging — scope a site, plan a campaign, and watch sediment move between surveys.
- Offshore energy and cable routing — screen nearshore approaches and landing corridors at country scale before you mobilise a single asset.
- Reef, habitat and marine science — map shallow seabed structure across whole atolls, and do it again next season.
- Nautical chart reconnaissance — flag what’s changed and point the survey boat where it’ll matter first.
- Disaster and storm response — re-map a coastline that moved overnight in days, not the months a survey would take.
Why we’re different
There are good people in this market. Here, plainly, is where we draw the line in a different place.
- We show our working. An independent LiDAR comparison in turbid water — not a cherry-picked clear-water number. It’s the first thing on our product page, not a footnote.
- We lead with honesty, not just the flattering number. The error bound, the visibility flag and the measured-versus-inferred line are the product, not the small print.
- We earned the right to mention turbid water. The case most providers quietly cap out on is the one we built to survive.
- Our processing is the moat. The same pipeline behind every Geopera order pulls a cleaner seabed signal out of the imagery — which is most of why our accuracy lands at the front of the field.
- We’re upfront about what we can and can’t see, and about price, the same way we approach every product.
The thread running through all of that is the same one that runs through everything we process: the inputs can be standard, even off the shelf — the advantage is the processing that cleans them up, the calibration against laser truth, and the honesty about the edges. That’s what you’re paying for, and it’s what puts the numbers where they are.
Try it on your coastline
If you’ve got a stretch of coast you need depth for — before you commission a survey, between surveys, or somewhere no survey has ever run — we can turn around a validated satellite-derived bathymetry map, with an error bound on every pixel, for any sunlit coast on Earth.
See the product and the full LiDAR validation →
Or tell us where you need depth and we’ll map it.