Bhote Koshi Flood 2026: A Reconstruction from Open Satellite Data
How open satellite imagery reconstructed the 26 August 2026 Nepal flood: flow heights, velocities, sediment depths, and an interactive 3D model.
Summary
- On 26 August 2026 a glacier collapse above the Lende Khola sent roughly 100 million cubic metres of debris-laden water down the Bhote Koshi and Trishuli rivers in Nepal. At least 289 people are confirmed dead as of 28 August, with more than 800 still out of contact, most of them far downstream between Dhading and Chitwan.
- Working only from openly licensed satellite data, we reconstructed the event in about 72 hours: flow heights of 70 to 134 metres in the gorges, velocities of 37 to 52 metres per second, and 10 to 18 metres of new sediment on the valley floor.
- The trigger is in the USGS seismic catalogue: a magnitude 5.2 signal at 08:37 local time, catalogued as a landslide, not an earthquake.
- Day-after WorldView-3 stereo imagery let us measure where the debris settled without anyone setting foot in the valley.
- Everything is downloadable: the source imagery, our co-registered and terrain-corrected rasters, every measurement, the model code, and the interactive 3D model at the top of this page.
Download the data: full archive, 32 GB, on Google Drive · derived data and measurements, 335 MB · code and methods. Licences and checksums are in the Take the Data section below.
This post documents a scientific reconstruction of a disaster in which many people died and many more are still missing. We have tried to write it the way we would want to read it: carefully, with the uncertainty stated plainly, and without turning a tragedy into a promotion. Casualty figures are those reported by Nepal Police and are provisional.
What Happened on the Morning of 26 August
At 08:37 Nepal time, a piece of glacier roughly 600 metres wide let go from the north flank of the Langtang Himal, at about 5,600 metres. It fell into the headwaters of the Lende Khola, a small river that joins the Bhote Koshi at the Nepal-China border crossing of Rasuwagadhi.
Here is the detail that reframes the whole event. Seismometers on the other side of the planet felt it. The USGS catalogue lists a magnitude 5.2 event at 28.271 N, 85.515 E at that exact moment, and the catalogue entry does not say earthquake. It says landslide. Early reporting had a quake triggering the collapse. The seismic record says the collapse WAS the shaking.
Falling ice makes a strange kind of flood. Friction melts it in transit. The melt grabs sediment, the sediment thickens the flow, the flow moves faster than clean water ever could. By the time it reached the border it was a wall. Twenty-three minutes, start to finish, from the seismic signal to the destruction of the customs complex.
-
08:37
Glacier collapse
M 5.2 landslide-type seismic event, upper Lende Khola. Recorded by USGS.
-
~09:00
Rasuwagadhi border crossing destroyed
Customs complex, friendship bridge and hydropower works swept away.
-
~09:10-09:25
Timure and Syabrubesi
Riverside settlements inundated within minutes of the front arriving.
-
~10:30
Peak passes Betrawati
50 km downstream of the source.
-
~11:00-12:00
Gauged reaches
Reported rises of 9 m in 30 minutes at Galchhi and 7 m at Malekhu.
Six hydropower stations gone along 60 kilometres of valley. And a grim piece of context: this same catchment flooded in July 2025, when a lake hiding on the Purepu Glacier drained without warning. Fourteen months, two disasters, one valley.
What the Satellites Saw
We want to be straight about the limits before showing the pictures, because the limits shaped everything.
It was monsoon season. Cloud cover on the day of the flood ran 62% to 93% across the optical passes, and one 15-kilometre stretch of the corridor, including Rasuwagadhi itself, had exactly zero cloud-free pixels on day one. We checked every scene. Zero. If you see anyone claiming a complete day-of optical picture of this event, they are describing something that does not exist.
What saved the analysis was the day after. Planet’s crisis response programme published PlanetScope from the morning of the flood, then SkySat and Pelican collections at 0.8 and 0.55 metres the next day. Vantor’s open data programme released four WorldView-3 strips at roughly 30 centimetres, and, in the detail that mattered most, two of them look at the valley from opposite directions. More on why that matters below.
30
satellite scenes analysed
0.3-3.8 m
resolution range
~72 h
event to full reconstruction
100%
openly licensed data
The clearest way to grasp the scale is to move a slider across it. Left of the handle is October 2021. Right is the day after the flood.
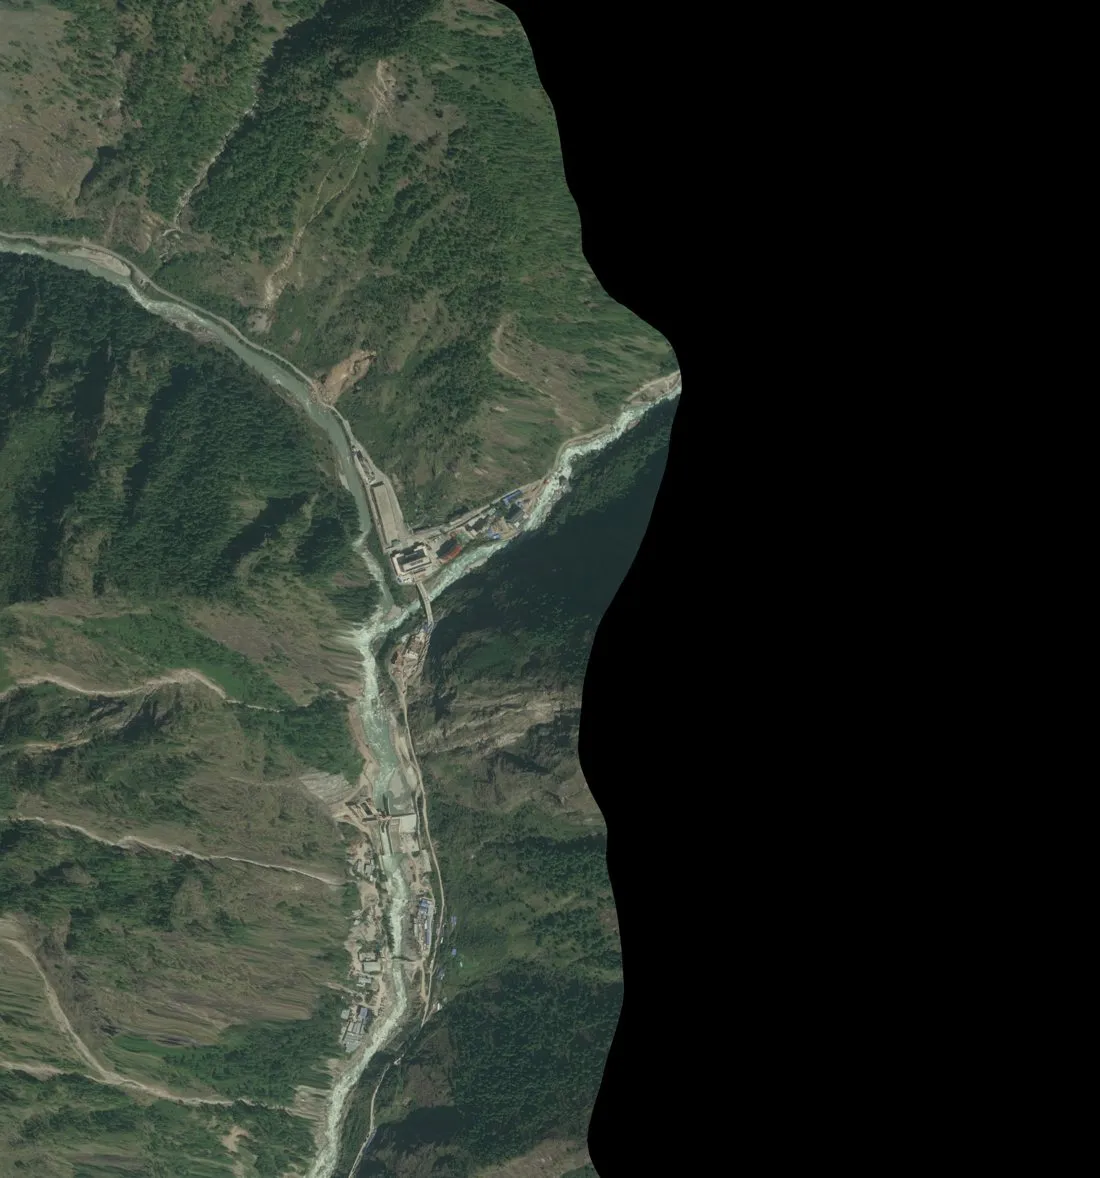
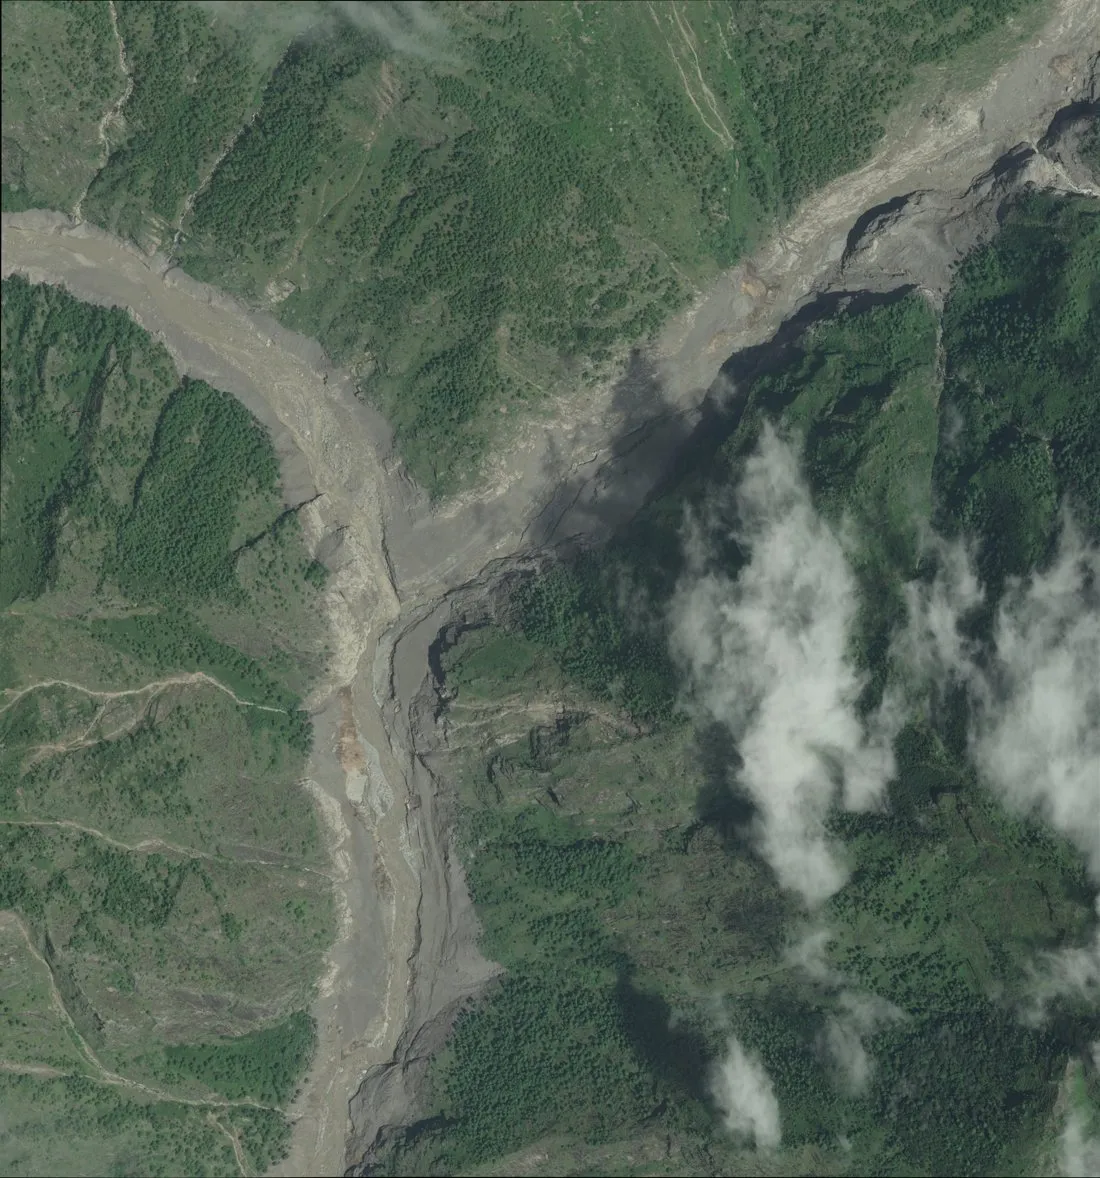
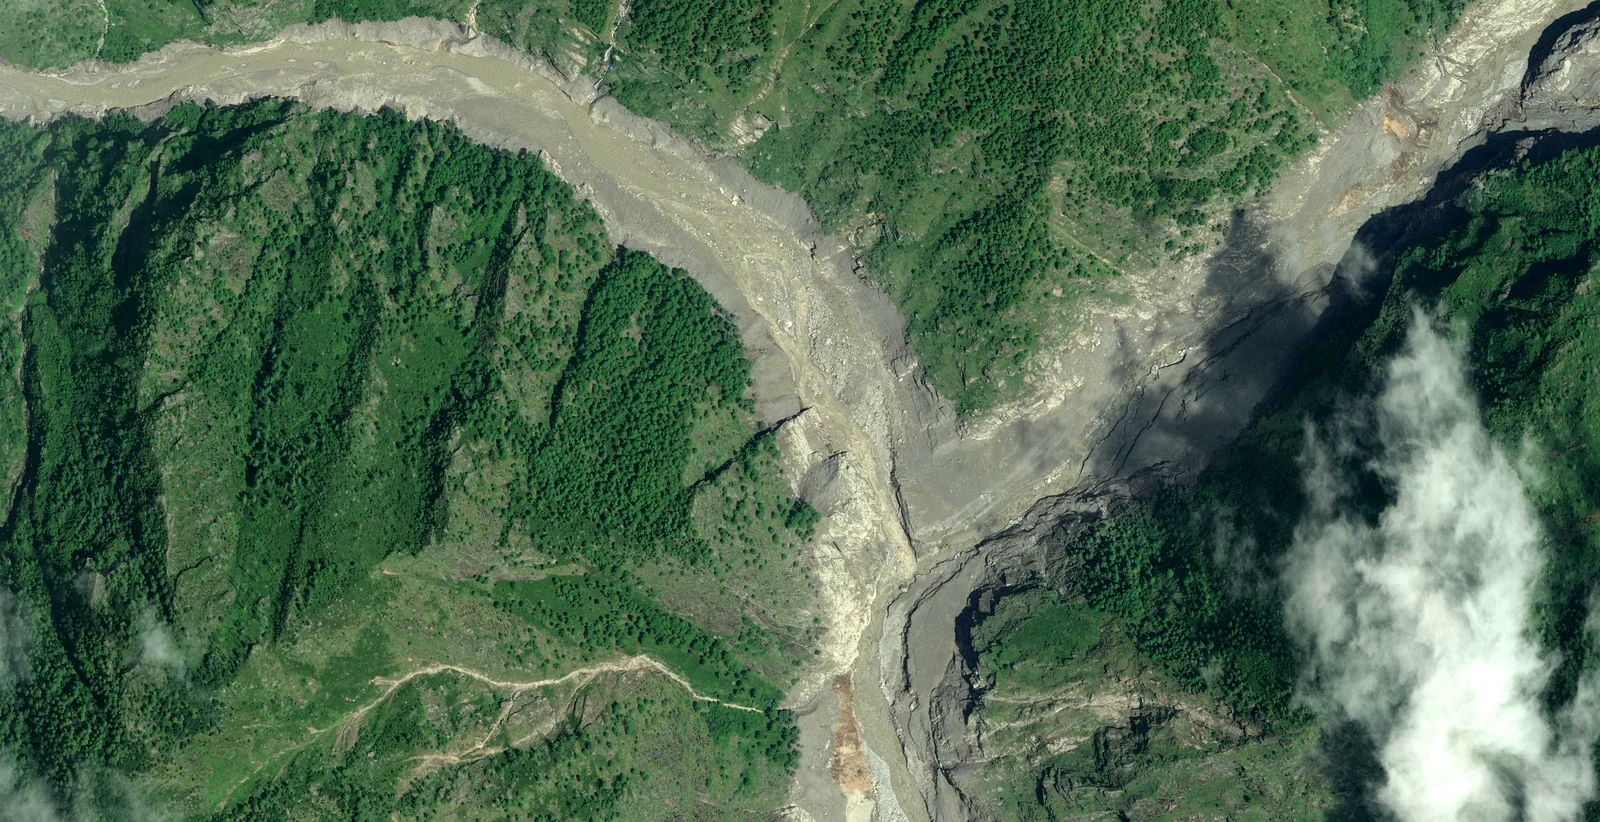
The customs complex, the bridge, the hydropower intake: gone. That grey sheet entering from the upper right is the Lende Khola. It used to be a river maybe 30 metres wide. It is now a debris surface wider than the settlement it destroyed.
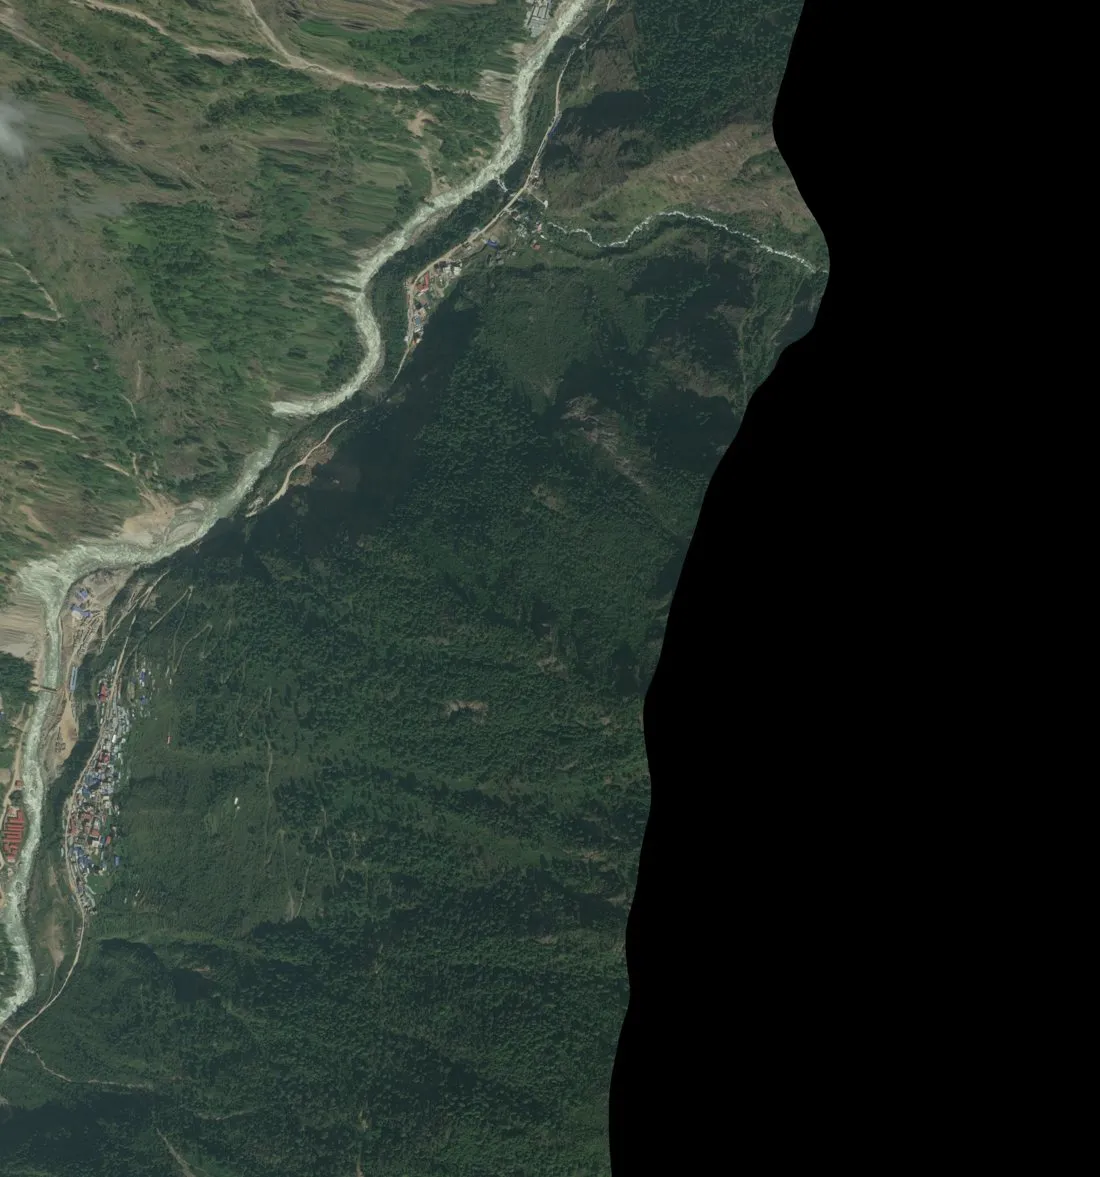
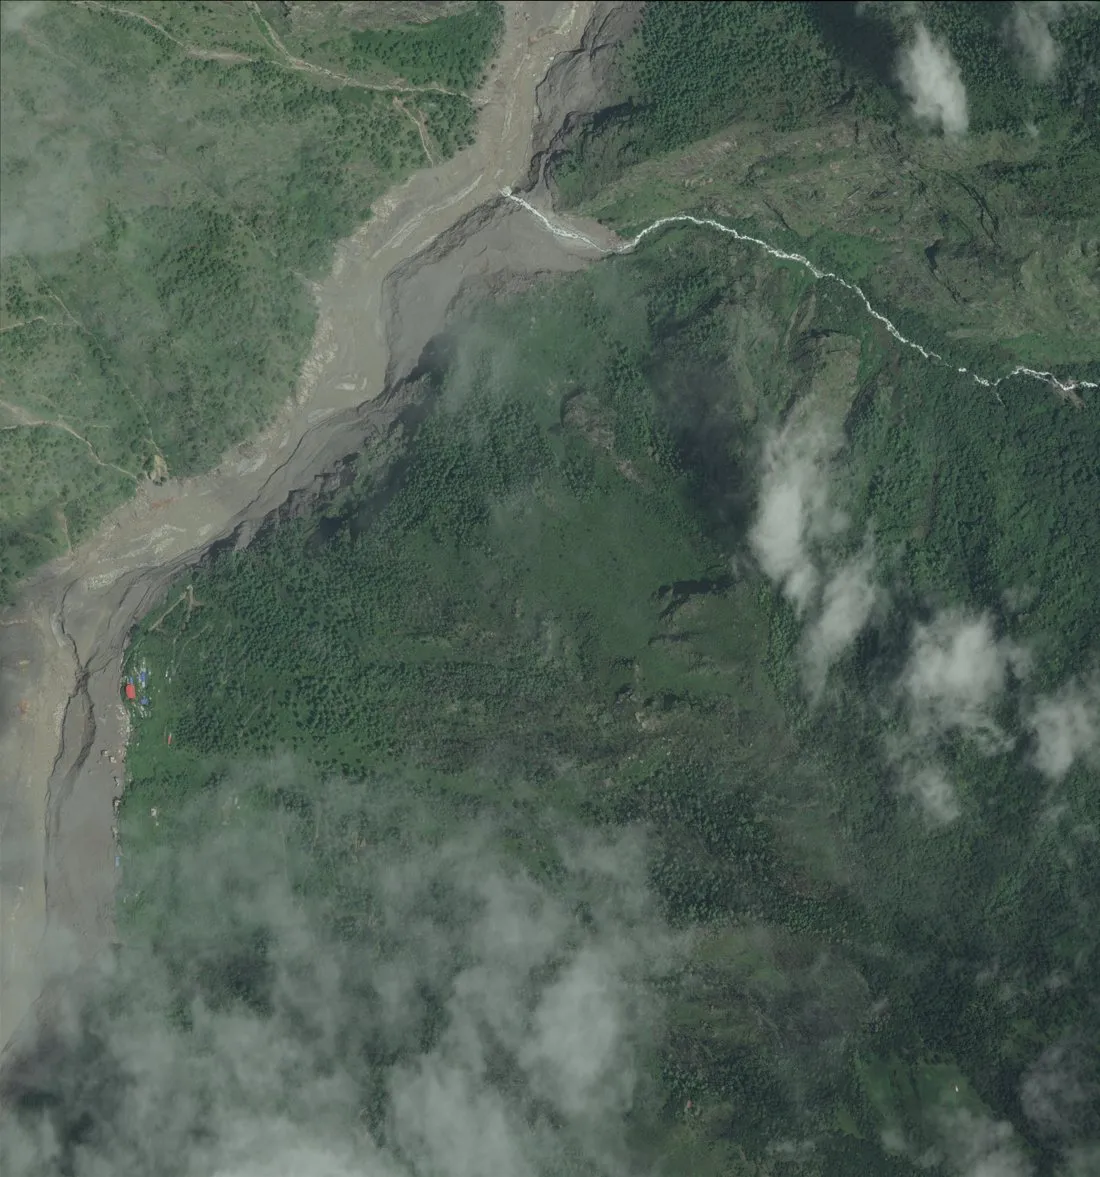
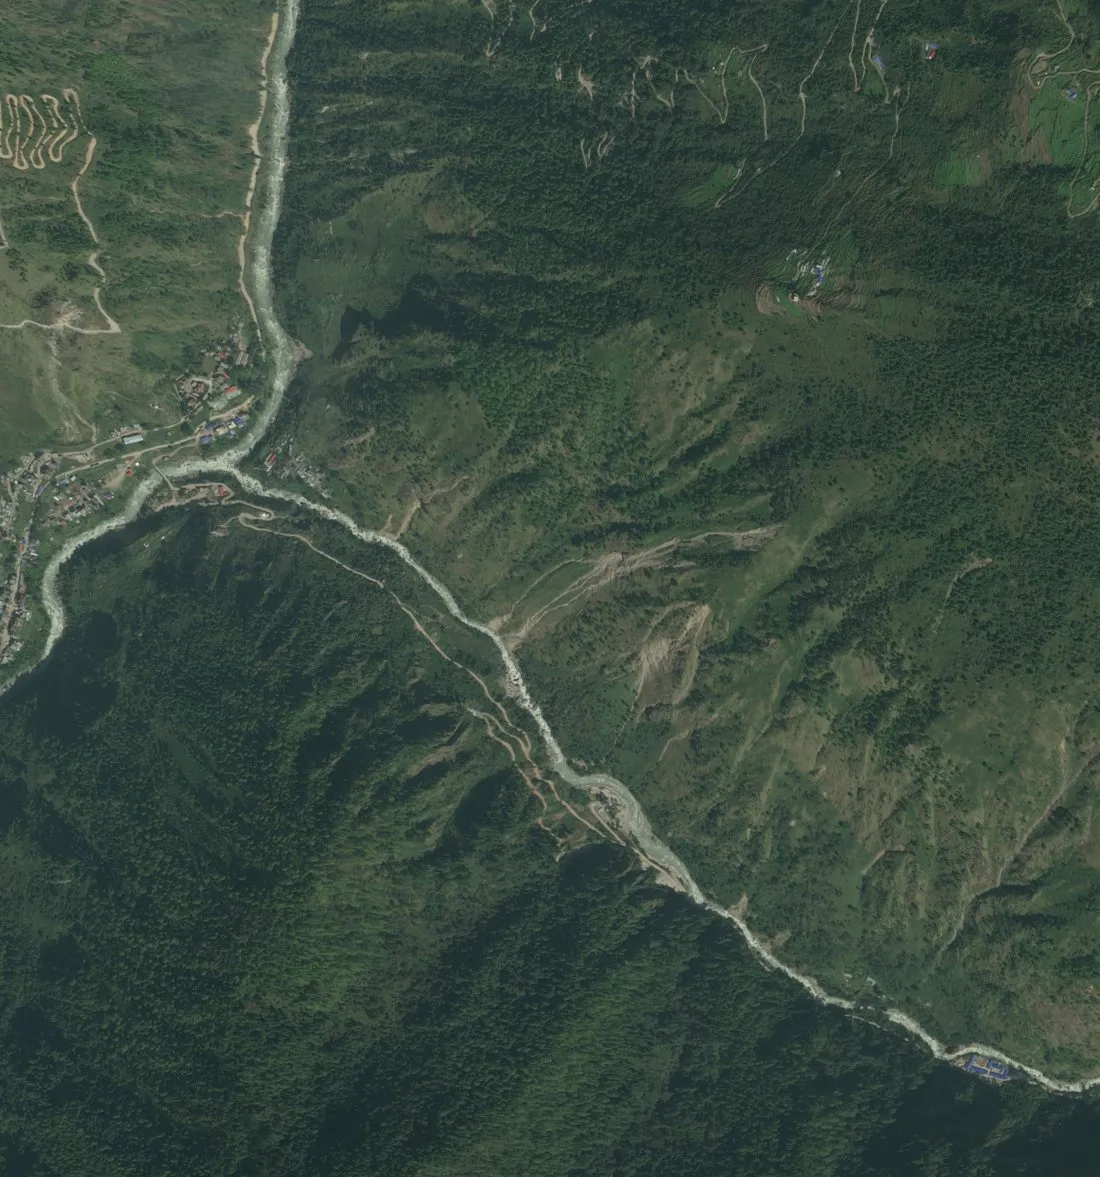
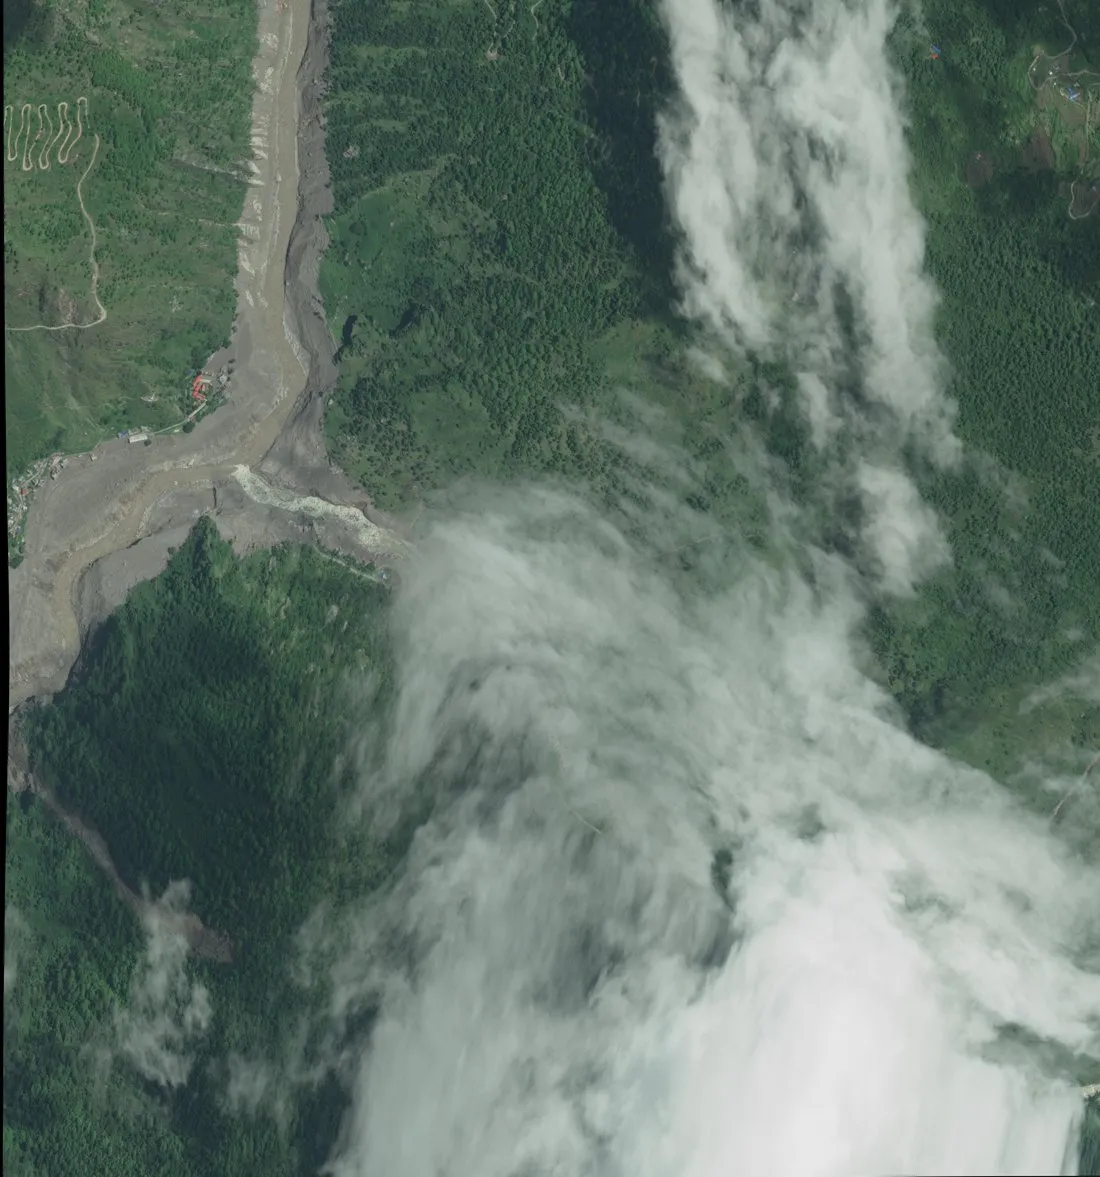
Look at Syabrubesi for a moment. The houses that survived are the ones sitting higher on the slope. That is not a metaphor. It is an elevation contour, drawn in buildings.
Measuring a Flood Nobody Could Reach
Field teams could not get into most of this corridor for days. So every number in this post had to come from orbit. Three measurements carried the analysis, and each one is a trick worth knowing.
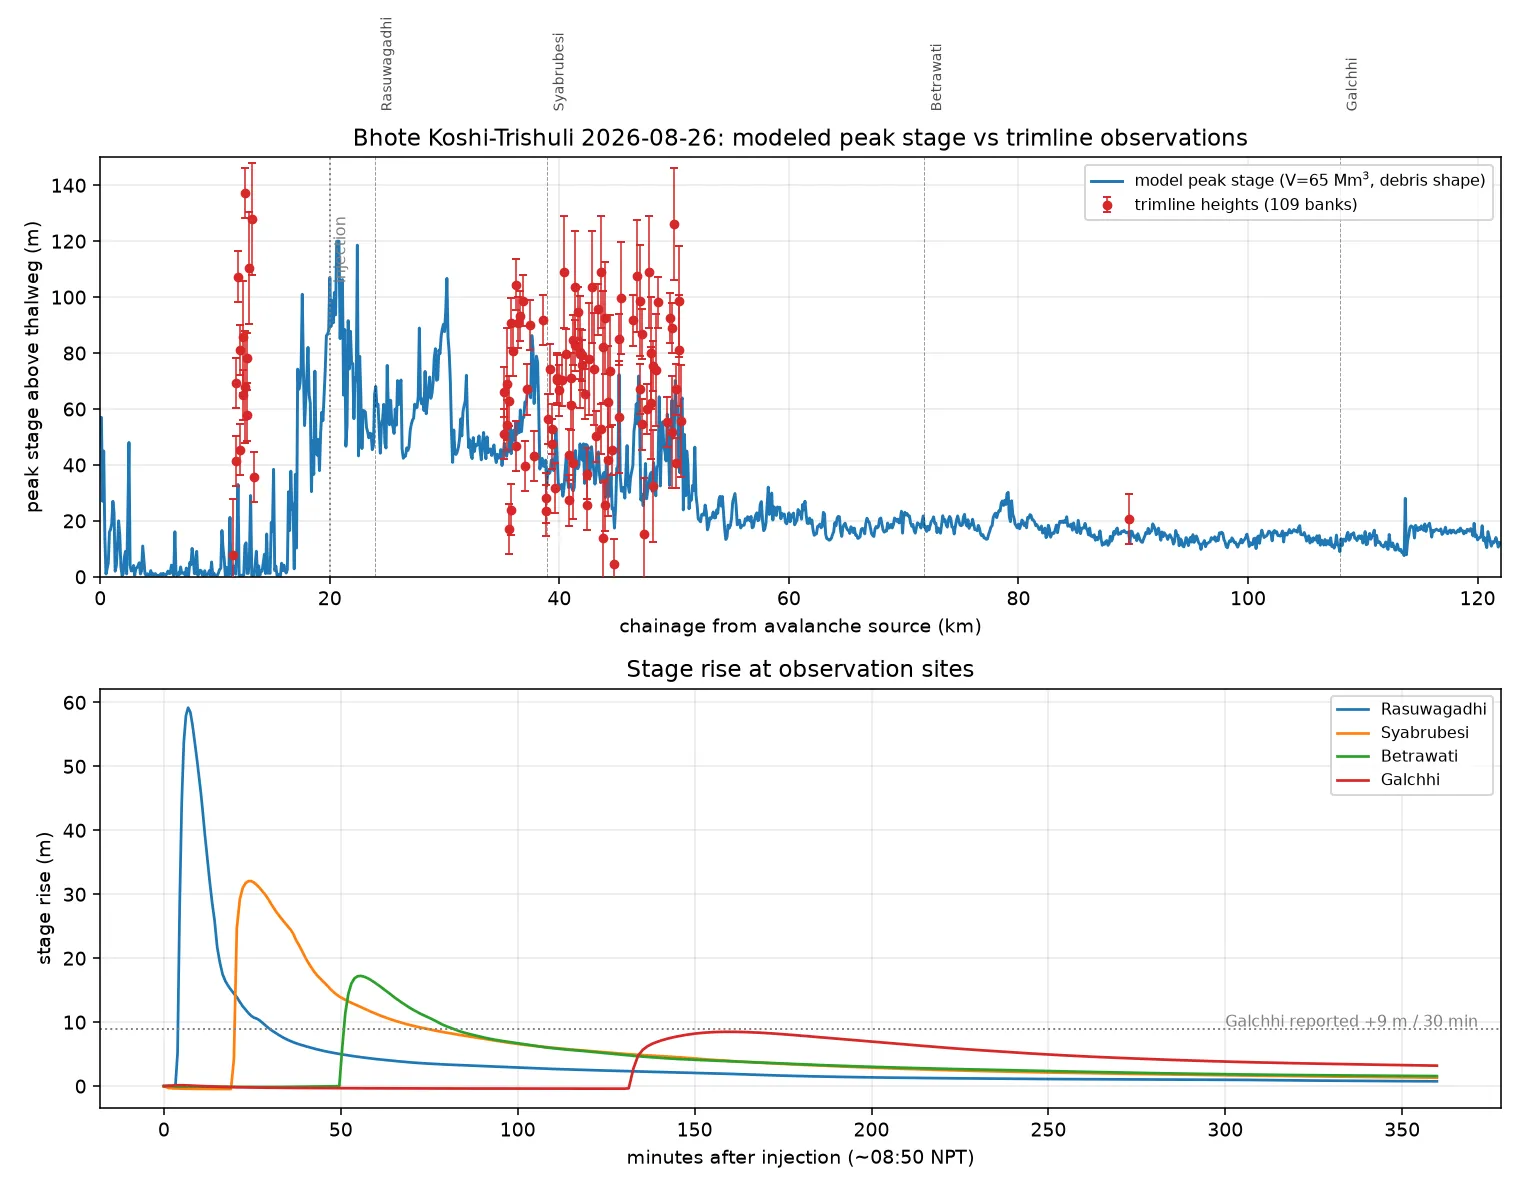
Flow height, from the bathtub ring. A debris flow scours vegetation and plasters mud up to its peak level, and that line survives on the valley walls after the water is gone. Hydrologists call it a trimline. We mapped the stripped zone from before-and-after imagery, draped it over a corrected elevation model, and read off the height at 217 individual bank positions. The median through the gorges is about 70 metres. At the border, individual measurements run 40 to 134 metres. One caution we will repeat because it matters: a trimline records the peak, splash and runup included, so treat these as upper bounds on the water itself.
Speed, from tilted water. Water going around a bend banks like a motorbike, higher on the outside wall than the inside. The tilt is preserved in the trimlines on the two banks, and a decades-old formula turns that tilt, the bend radius, and the channel width into a velocity. The chain of estimates reads: 37 metres per second in the Lende Khola, 45 to 52 at the border, 50 in the gorge, and then a sudden drop to 11 where the valley opens at Syabrubesi. That collapse in speed is the flood hitting the brakes, and you will see in the next measurement exactly where the braking energy went.
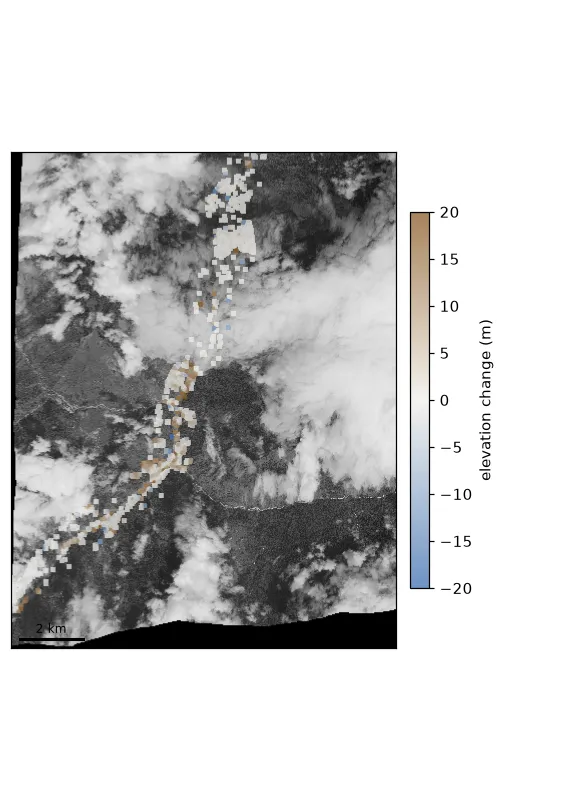
Sediment depth, from two photos that disagree. This one is our favourite, and it needs an analogy. Photograph a table from the left, then from the right. If someone slips a book under the tablecloth between your two shots, the bump sits in a different place in each photo. The size of the disagreement tells you the thickness of the book. Two of the WorldView-3 strips view the valley from opposite directions, and both were map-corrected using terrain from BEFORE the flood, so wherever the flood changed the ground, the two images disagree. We matched 20,500 points between them and converted the disagreements into elevation change. The result: a wedge of new valley floor, 10 to 18 metres thick, through the gorge where the flow decelerated, thinning to about 4 metres at Syabrubesi. Roughly 12 million cubic metres of rock and mud, weighed from space.
What Each Dataset Actually Did
A reconstruction like this is a relay, not a single hero sensor. Every dataset covered a specific blindness in the others.
| Dataset | What it gave the model | What it could not do |
|---|---|---|
| USGS seismic catalogue | The trigger’s location, size, and the exact second the clock starts | Nothing about the water |
| PlanetScope (3.8 m, day of) | Flood extent in the cloud gaps, hours after the peak | 62-93% cloud; blind over the border reach |
| SkySat + Pelican (0.8/0.55 m, day 1) | Sharp post-event ground detail; filled the day-one gaps | Still cloudy; no height information |
| WorldView-3 stereo (0.3 m, day 1) | Sediment depths via parallax; trimlines at the border | Its own quality masks flagged clear ground as cloud, so we masked it ourselves |
| WorldView-2 archive (2021) | The before picture every comparison depends on | Predates the July 2025 flood in this valley |
| NASA HMA 8 m DEM | The terrain every height and every simulation stands on | From 2017 imagery; ellipsoidal heights needed datum correction; 12% voids near the channel |
| Copernicus GLO-30 | Filled the DEM voids; cross-checked the datum fix | Too coarse to carry the analysis alone |
| Sentinel-2 | We tried to extend coverage downstream with it | Joint clear-sky with the pre-event pass: 2.1%, none of it on the river. A documented failure |
| OpenStreetMap | Building footprints for impact counts; the Lende Khola’s own name | Building heights are guesses |
| Reported gauge readings | The 9 m rise at Galchhi that calibrated the model’s volume | Media-relayed figures, not raw agency records |
Two of those rows deserve a sentence each. The Sentinel-2 row is in there because negative results belong in the record: we burned an afternoon proving the monsoon beat us on that axis, and anyone repeating this work deserves to know before they burn theirs. And the WorldView row hides the single most useful accident of the week: those strips were collected as a stereo pair. Without that accident there is no sediment map at all.
The Model, and Whether to Believe It
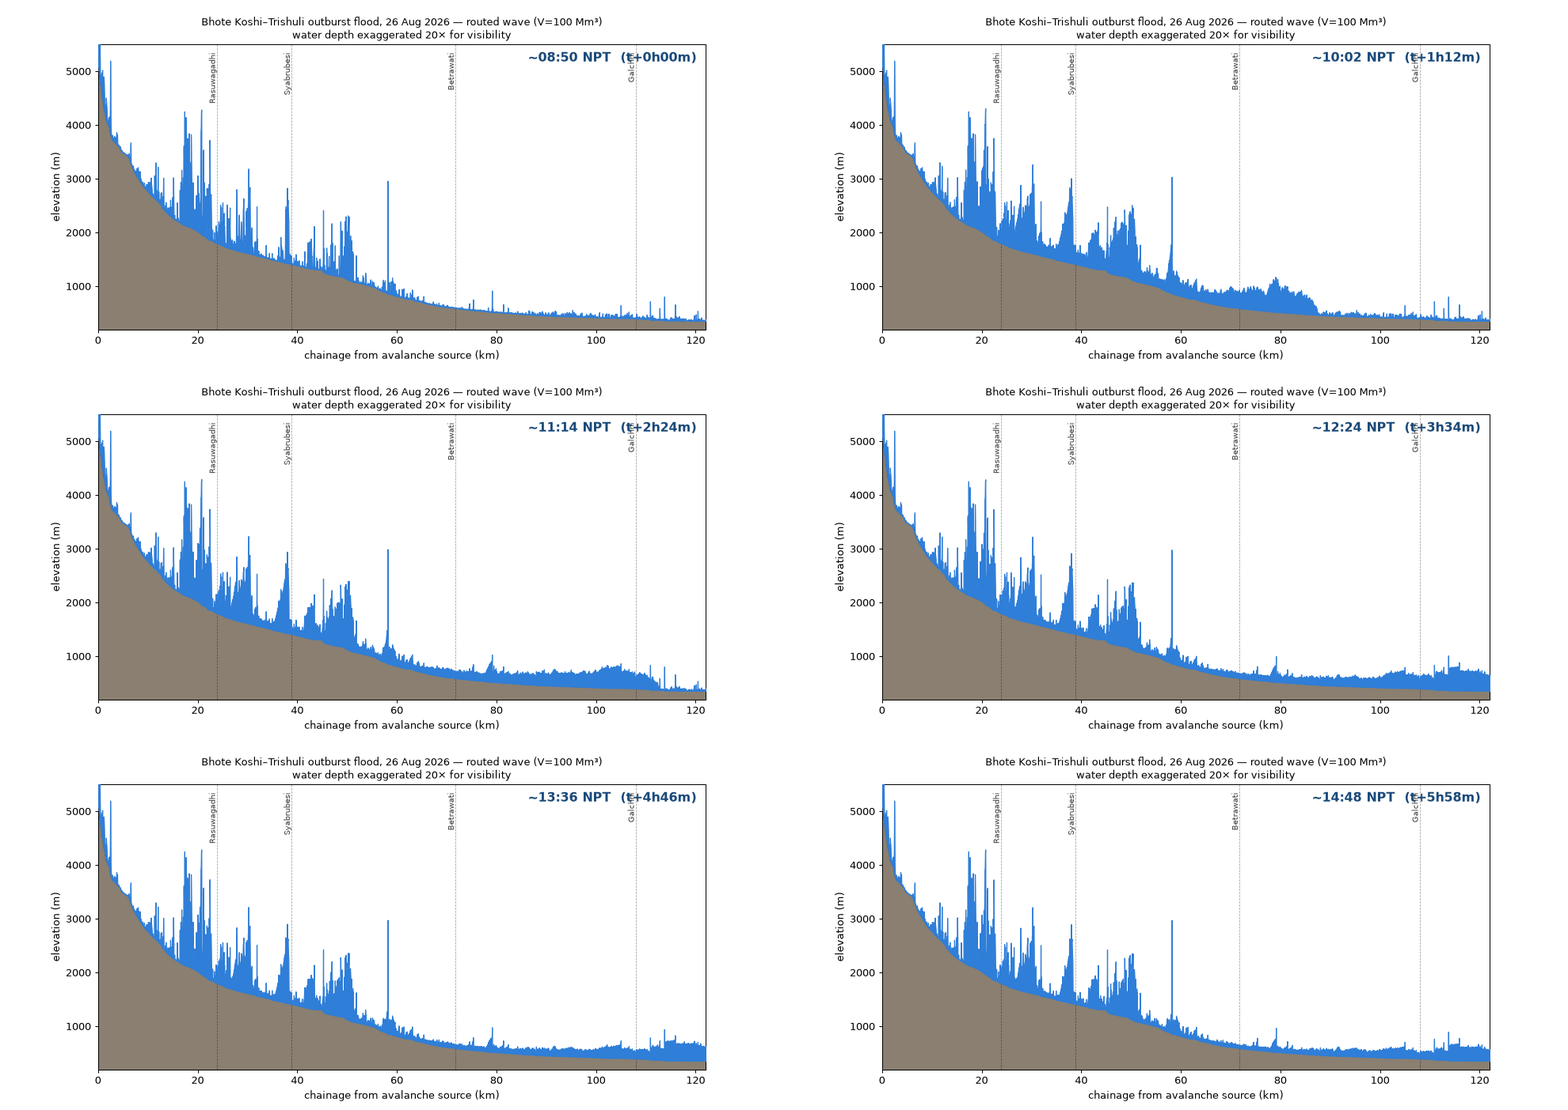
We routed the flood down 611 measured river cross-sections in a one-dimensional model, then ran a two-dimensional model of the Syabrubesi gorge on top. One unknown mattered: how much material came down. Two observations that know nothing about each other pin it. The reported 9-metre rise at the Galchhi gauge, 85 kilometres from the source. And the 48-to-70-metre band of trimline heights in the gorge, 35 kilometres upstream of that gauge. One volume satisfies both at once: about 100 million cubic metres, give or take 40%.
Then the model did the thing you hope for and rarely get. We calibrated it before the day-two imagery existed, and it predicted a 90-metre peak stage at Rasuwagadhi, sight unseen. The WorldView strips arrived the next morning. The trimlines at the border measured 40 to 134 metres, maximum 134. The prediction sat inside the observed envelope, made before the observation. That is the difference between a model that explains and a model that anticipates, and it is the main reason we are willing to publish numbers this young.
The same test buried one early theory. A popular explanation held that the avalanche dammed the river, a lake built up, and the dam burst. We simulated it. A sustained dam-and-breach arrives at the border 30 to 60 minutes too late, rises far too gently for the eyewitness accounts of a wall, and peaks at a third of the measured heights. What the data cannot distinguish is a direct debris flow from a blockage that failed within a couple of minutes. Both fit everything we can measure. Honesty requires leaving that open.
Take the Data
Everything is packaged and free, and we have done the unglamorous preparation so you do not have to: all rasters are co-registered onto one grid (EPSG:32645), the elevation model is datum-corrected and void-filled, every measurement carries its uncertainty, and the co-registration audit ships as a document beside the data. If you have ever lost a week discovering that your DEM is in ellipsoidal heights while your gauge data is orthometric, you know why we mention this. That week is already spent. It was ours.
- Full archive (32 GB): source imagery, all rasters, measurements, models, documentation. Download from Google Drive. SHA-256 in the manifest alongside.
- Just the science (335 MB): measurements, model outputs, masks, docs. Download from the repository release.
- Code and methods: the full reconstruction pipeline is public at github.com/geo-pera/bhotekoshi-2026-reconstruction.
- Source imagery programmes: Planet Crisis Response and Vantor open data (s3://vantor-opendata). A broader guide to free satellite data sources is maintained separately.
Derived products inherit CC BY-NC 4.0 from the source imagery. If you are working on the response or on research into this event and data processing is your bottleneck, write to us and we will help, without charge. Community groups are already maintaining crisis datasets for this event; they deserve the traffic.
Ten years ago this analysis was a funded research project and a season of work. It took us three days, and the reason is not cleverness. The reason is that Planet published within a day, Vantor released 30-centimetre stereo for free, NASA’s terrain was already sitting there, and a seismometer network logged the trigger to the second. Open data did not make the flood less terrible. It made the flood measurable, fast, by anyone. That seems worth building on.
Frequently Asked Questions
What caused the 2026 Bhote Koshi flood in Nepal?
A collapse of glacier ice and rock, roughly 600 m wide, from about 5,600 m on the Langtang Himal at 08:37 on 26 August 2026. USGS catalogued the collapse itself as a magnitude 5.2 landslide-type seismic event. It was not triggered by an earthquake.
How high did the flood reach?
Trimline measurements from satellite imagery show a median flow height near 70 metres through the confined gorges, with individual bank measurements from 40 to 134 metres at the Rasuwagadhi border crossing. These are peak-stage values and include splash and runup.
Was it a glacial lake outburst flood (GLOF)?
Current evidence says no pre-existing lake drained. The flow’s water came from melted avalanche ice, entrained sediment and the river itself. A short-lived blockage that failed within minutes cannot be ruled out; a sustained dam-and-breach sequence is excluded by timing and flow heights.
Is there satellite imagery of the Nepal flood?
Yes, and most of it is free. Planet’s crisis response dataset and Vantor’s open data programme both published pre- and post-event imagery, from 3.8 m down to 30 cm, under CC BY-NC 4.0 licences. Direct downloads are in the Take the Data section above.
How was sediment depth measured without field access?
From the parallax between two WorldView-3 images taken from opposite look angles. Both were orthorectified against pre-event terrain, so surface changes displace the images relative to each other. Dense image correlation converted that displacement into 10 to 18 metres of measured deposition.