The Bhote Koshi Flood in Half-Metre Relief: What the Stereo Data Changed
Vantor released the raw WorldView-3 stereo strips from the 2026 Nepal flood. The elevation model we built from them rewrote our sediment story, confirmed a model prediction, and counted the buildings the river took.
Summary
- On 31 August, Vantor added the raw WorldView-3 stereo strips from 27 August to its open data bucket, with camera models attached. From them we built a half-metre elevation model of the flood corridor and differenced it against pre-event terrain.
- The measurement rewrote our sediment story, and we owe readers a correction. The parallax-based deposition map in our first post assumed the two looks view the valley from opposite directions. They do not, and that map is retracted. This post explains the error and what the real measurement says.
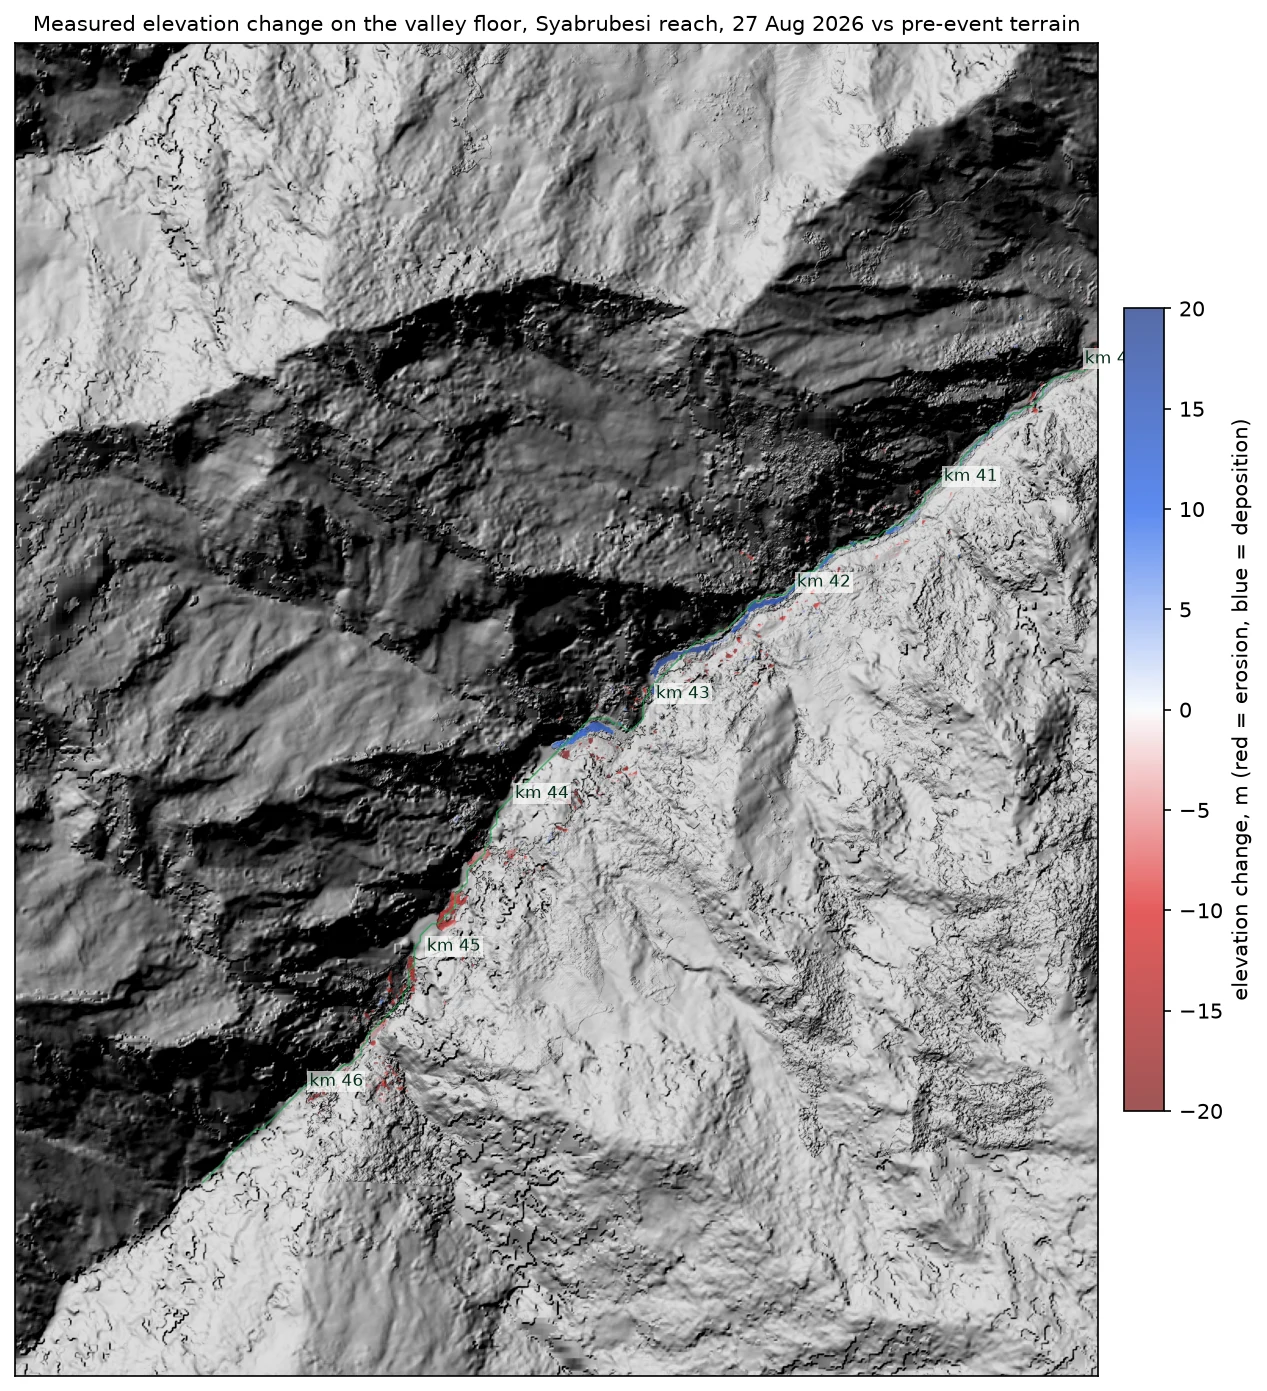
- What the flood actually did: it scoured its bed through every confined reach, 2 to 12 metres of floor lowering from the border gorge down, dumped a debris sheet 12 to 18 metres thick and three kilometres long where the valley opens below Syabrubesi, and has already cut a 13 to 21 metre trench back through its own deposit downstream.
- Our morphodynamic model put the deposit in the right place before the data existed to prove it, even though we had calibrated it against the measurement that turned out to be wrong.
- Building by building, where the sky was clear: 27 structures destroyed in the Syabrubesi reach, most of them lost with the riverbank itself rather than to water alone. Timure sits under cloud in the stereo pair, so its count must come from other sources.
- The elevation model, the change rasters with per-pixel uncertainty, the damage census, and a per-kilometre sediment budget are all released under the same open licence as the imagery they came from.
This post continues our reconstruction of the 26 August flood. The human toll of this event is severe and still being counted; casualty figures in the earlier post are reported values from Nepal Police and remain provisional.
First, the correction
Our first post measured sediment depth with a trick we were fond of: two images of the same valley, both map-corrected using pre-event terrain, disagree about the position of anything the flood raised or lowered, and the size of the disagreement gives you the elevation change. The trick is real and the physics is sound. But it depends entirely on knowing the viewing geometry, and we got that wrong. We assumed the two WorldView-3 strips look at the valley from opposite sides. Reading the actual camera models shows they are same-side, in-track stereo. The along-valley disagreement we converted into a sediment wedge was three times too small to carry the signal we claimed, with the sign flipped, and the map we published was dominated by small registration differences between the vendor’s ortho products. The 12 million cubic metre wedge at kilometres 33 to 38 was not sediment. It was noise wearing a costume.
We found this out the honest way: a second, independent measurement refused to agree with the first. When the rigorous elevation model described below came back showing scour where the parallax map showed deposition, we re-derived the viewing geometry from the camera files, re-measured the parallax ourselves under the corrected geometry, and watched the discrepancy resolve to within a metre. Three separate checks converged on the same conclusion. The retraction is posted in the data repository, the invalid map layers are withdrawn, and everything that depended on them has been recomputed from the new measurement.
One lesson worth passing on: the wrong map behaved beautifully on stable ground, which is exactly why we trusted it. Vendor orthos are registered to a reference base, so quiet terrain agreed to half a metre and looked like quality. The failure lived only where the ground had changed, which is the one place a change measurement cannot be checked against itself. Independent methods are not a luxury.
What the flood actually did to the valley
The stereo strips are a different class of input from the orthos: full-resolution imagery with camera models, which supports true photogrammetry. We refined the cameras until the two looks agreed to a quarter of a pixel, masked the clouds, matched the pair densely at the native 34 centimetres, and co-registered the resulting surface to pre-event terrain on ground the flood never touched. On that stable ground the model agrees with the reference to about a metre and a half, and every number below survived a set of checks designed to kill it: a bias gate on flat ground, exclusion of cells where the pre-event reference itself was interpolated, and a per-pixel uncertainty estimate carried through to every volume.
Read the corridor from north to south and the flood tells its own story. Through the border gorge past Rasuwagadhi, the floor came out 8 to 12 metres lower: the flow was digging, not dumping. Down the narrow reach above Syabrubesi it kept digging, 2 to 5 metres in most sections, and it stripped the forested banks so thoroughly that they now sit several metres below the pre-event canopy surface. Then, at kilometre 40.5, the valley opens. Within a kilometre the signal flips from red to blue: a debris sheet three kilometres long and 12 to 18 metres thick in its core, exactly where our velocity measurements had the flow decelerating from 50 metres per second to 11. And below the sheet, where the valley narrows again, the strongest signal in the whole dataset: the river has already incised 13 to 21 metres, partly through its own fresh deposit, partly into the older floor.
The honest numbers on volume are lower bounds, and we will state them as such. Clouds covered most of both stereo looks, so the model sees about 45 percent of the valley floor in the two clear windows. Over the floor it can see, we measure roughly 0.9 million cubic metres of deposition and 3.2 million of erosion, with the thickest part of the deposit partly hidden under cloud. What the measurement rules out is any story in which tens of millions of cubic metres settled in the upper corridor. The bulk of the solid load went further downstream than our retracted map claimed, or is spread thinner than the resolution of a valley-scale budget.
The model knew before we did
Here is the part we did not expect. Our morphodynamic simulation, the one that models the flood picking up and dropping sediment as it runs, had been calibrated against the retracted parallax map. The calibration tried to pull the model’s deposition toward kilometres 33 to 38, because that is where the false wedge sat. The model would not fully go. Its physics kept the sediment in suspension through the confined gorge and dropped it where the flow decelerated at the valley opening, centred near kilometre 40, with its thickest predicted bin at kilometre 42.5. That is, within a bin, where the stereo model now measures the real deposit.
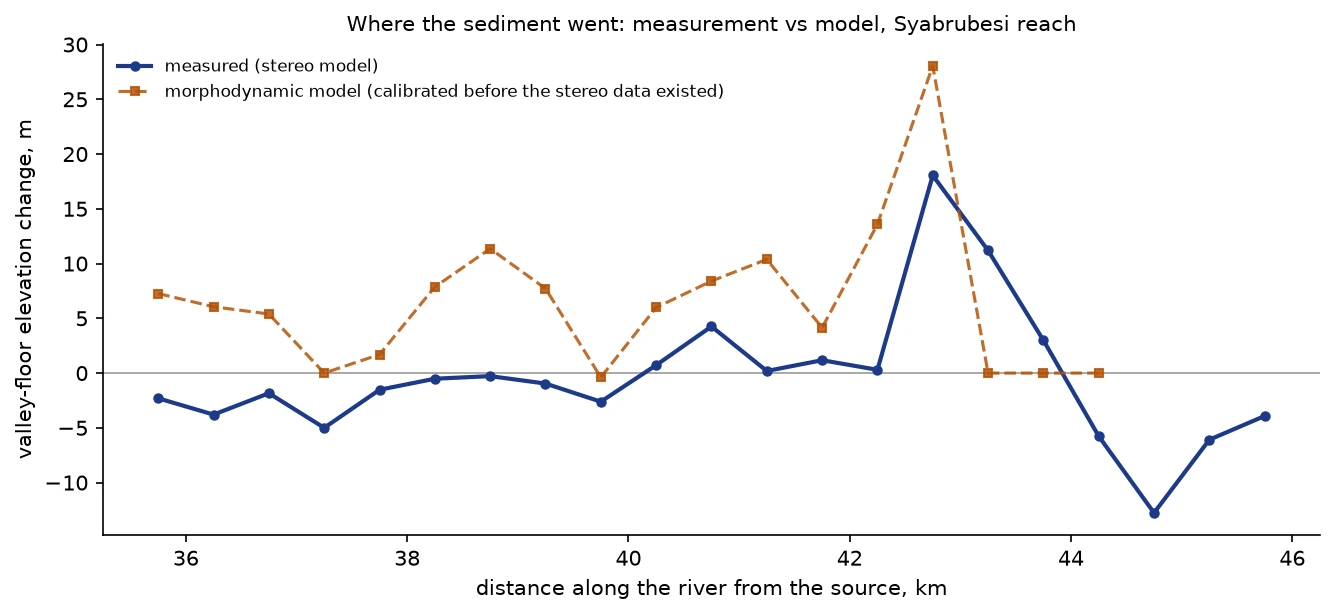
We want to be careful not to over-claim here. The model over-deposits by roughly a factor of two, it smears some mass upstream, and being right about where is easier than being right about how much. A recalibration against the real measurement comes next and should tighten both. But the shape of the result stands: a process model, fed bad calibration data, disagreed with that data in the direction that turned out to be true. When the physics and the measurement argue, it is worth finding out why before betting on either.
Buildings, one by one
At half-metre resolution, elevation change becomes a damage census. We intersected the model with OpenStreetMap building footprints along the corridor and classified each building by the change under it and around it, with two filters that mattered: a building only counts as buried if the open ground beside it also rose, and only counts near the river, because ten years of tree growth against an older reference produces false positives on hillside villages that no flood reached.
The result, for the reach the stereo can see: 27 buildings destroyed. Twenty-four of them went with the ground they stood on, including a block of about twenty on the Syabrubesi riverfront where three to four metres of terrace eroded away, and two buildings near kilometre 44.5 that dropped with twenty metres of bank into the new trench. Three more were removed from ground that survived. About 1,470 buildings in the same reach read as probably intact, and 1,135 could not be assessed under cloud.
Two limits, stated plainly. Timure, which day-after imagery shows badly damaged, sits almost entirely under the cloud mask, so our census is blind exactly where the damage is known to be severe; treat the counts as a floor, not a total. And OpenStreetMap coverage in the upper valley is sparse, so the census can only count buildings somebody has mapped. The full per-building GeoJSON, classes and caveats included, is in the release.
Counting boulders from orbit
One more thing a half-metre surface makes possible: a boulder census. We ran a local-relief detector over the debris sheet and it found 4,329 individual clasts larger than a metre across, on 37 hectares of fresh deposit. The 84th-percentile diameter is about 7 metres. The largest block we can resolve is 26 metres across, a piece of mountain the size of an apartment building, carried at least several kilometres and set down on the valley floor.
Boulder sizes are more than a curiosity, because moving a block takes a calculable amount of flow. Applying Costa’s empirical competence relation to the largest clasts, bin by bin along the deposit, gives transport velocities of 19 to 26 metres per second through this reach. Our superelevation measurements, made from tilted trimlines kilometres upstream, gave 50 metres per second in the gorge and 11 at Syabrubesi. The boulders slot between them, from an entirely independent line of physics. Two caveats for anyone reusing the census: at half-metre resolution, adjacent boulders merge, so the large tail is more trustworthy than the small end; and near the town, some detections are probably building debris rather than rock.
Five days later, the river is already editing
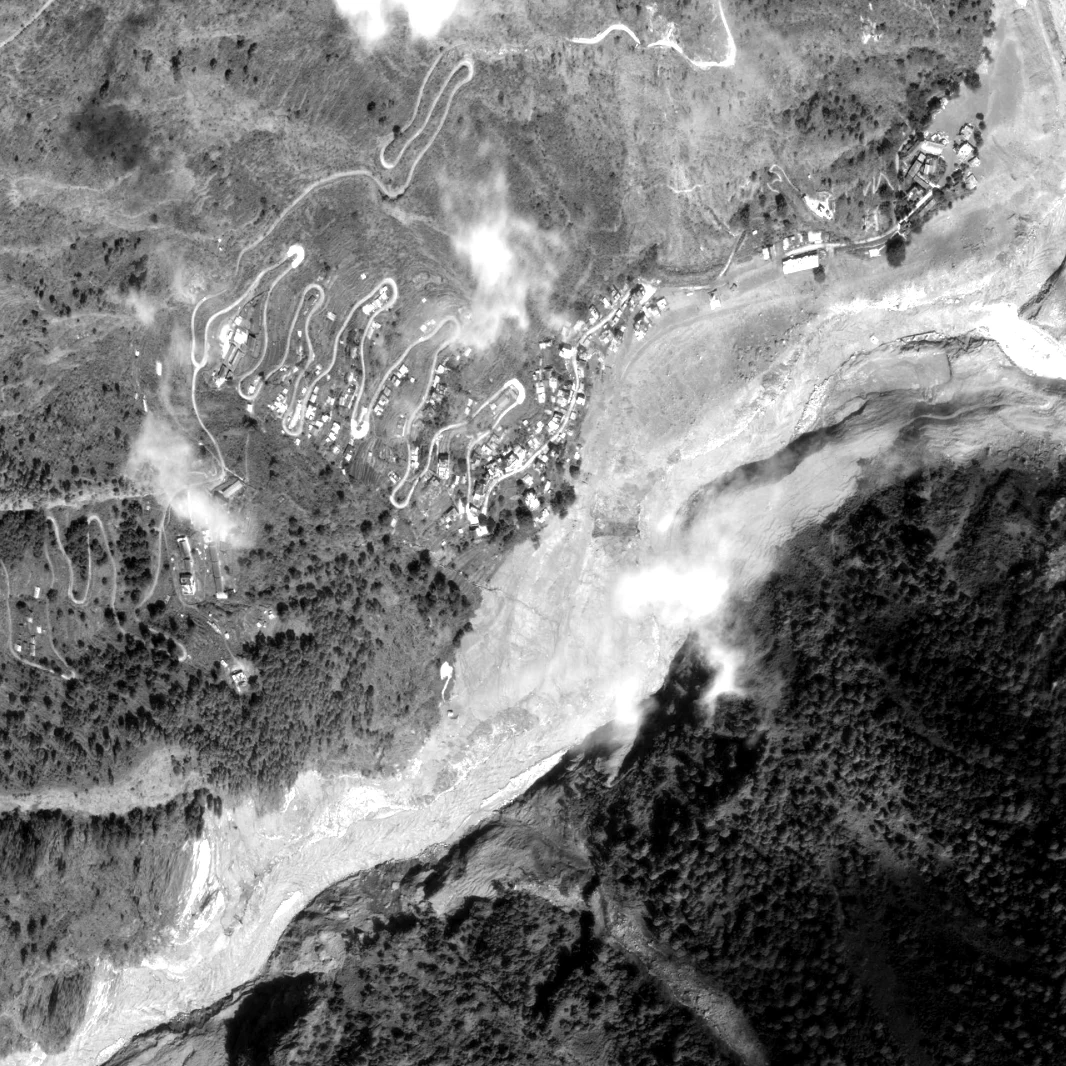
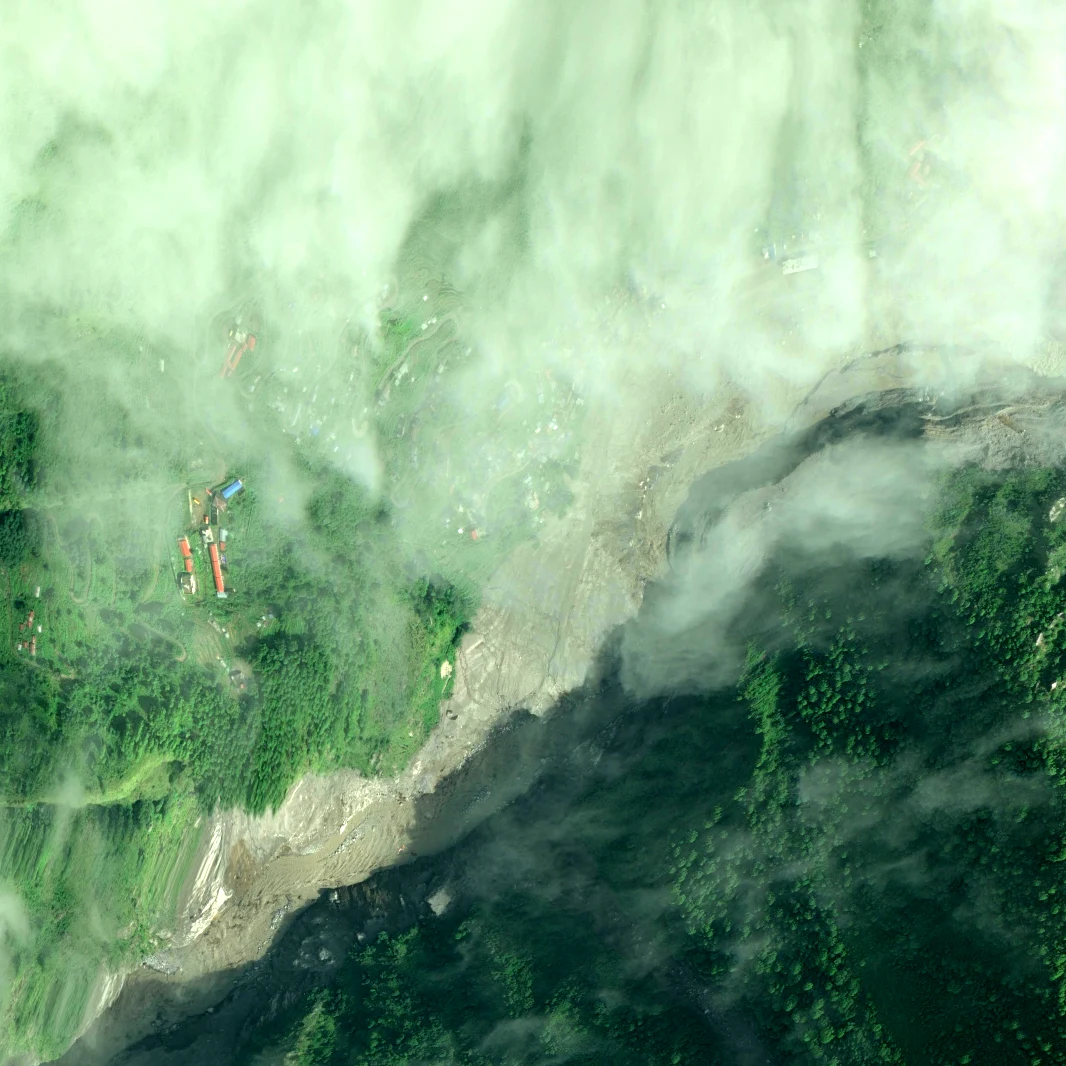
The newest scenes in the open data bucket were collected on 1 September, five days after the flood. Cloud cover is heavy, but the Syabrubesi confluence is visible, and the comparison with 27 August shows the next chapter starting: the braided sheet the flood left behind has organised into a defined channel, cutting into the fresh deposit. The 13 to 21 metres of incision our elevation model measured downstream is the same process further along. Valleys do not keep the shape a flood leaves them in.
Take the data
Everything is released under CC BY-NC 4.0, matching the licence on the source imagery, in the reconstruction repository:
- The half-metre elevation models for both clear-sky reaches, in EGM2008 heights, co-registered to the pre-event terrain.
- Elevation-change rasters at 2 metres with a per-pixel uncertainty layer, the artefact masks we applied, and the per-kilometre sediment budget as CSV.
- Corrected deposition and erosion polygons, replacing the retracted layers, the building damage census for both reaches as GeoJSON, and the boulder census as CSV.
- The retraction note itself, in the repository README, with enough detail to check our reasoning.
The full release is also mirrored on Google Drive, in the same folder as the original 32 GB analysis-ready archive.
Our thanks again to Vantor for releasing the stereo strips with camera models attached after the community asked, and to Planet, Copernicus, NASA and USGS for the open data underneath everything here. If you find an error in this analysis, tell us. The fastest correction we can make is the one somebody hands us.