The Flood You Could Hear: Bhote Koshi in the Seismic Record
A public seismometer 17 km from the river recorded the Bhote Koshi disaster twice: the glacier collapse as a sharp spike, and then three hours of the flood itself, audible through the ground.
Summary
- A public broadband seismometer at Kakani, 17 to 55 kilometres from the flood corridor, recorded the 26 August disaster twice over.
- First, the glacier collapse itself: a spike ninety times above background, the signal the USGS catalogued as a magnitude 5.2 landslide.
- Then something we had not seen discussed anywhere: after the collapse signal faded, the ground vibration rose again into a broad plateau, twelve times background, and stayed elevated for roughly three hours. That is the flood itself, millions of tonnes of water and rock grinding down the valley, audible through the earth from the next district.
- The rise and fall of that vibration tracks the flood’s position from our satellite-and-simulation timeline. Two unrelated instruments, one story.
- The data is public. We give the station, channel, and time window below so anyone can pull the same waveforms.
This post is part of our reconstruction of a disaster in which hundreds of people died, and we have tried to write it with the same care as the rest of the series. Casualty figures reported elsewhere in the series are those of Nepal Police and remain provisional.
Two signals, one morning
Seismometers are usually described as earthquake instruments, but they are simply very sensitive listeners. Anything that shakes the ground hard enough, for long enough, leaves a record: trains, quarry blasts, storms at sea, and, it turns out, a valley being rearranged.
Station KKN sits on the Kakani ridge northwest of Kathmandu, operated as part of Nepal’s open seismic network and freely available through EarthScope. On the morning of 26 August it was between 17 and 55 kilometres from the various reaches of the Bhote Koshi and Trishuli as the flood descended them. We pulled its vertical-channel record for the five hours around the event and filtered it to the 1 to 8 Hz band where debris flows speak.
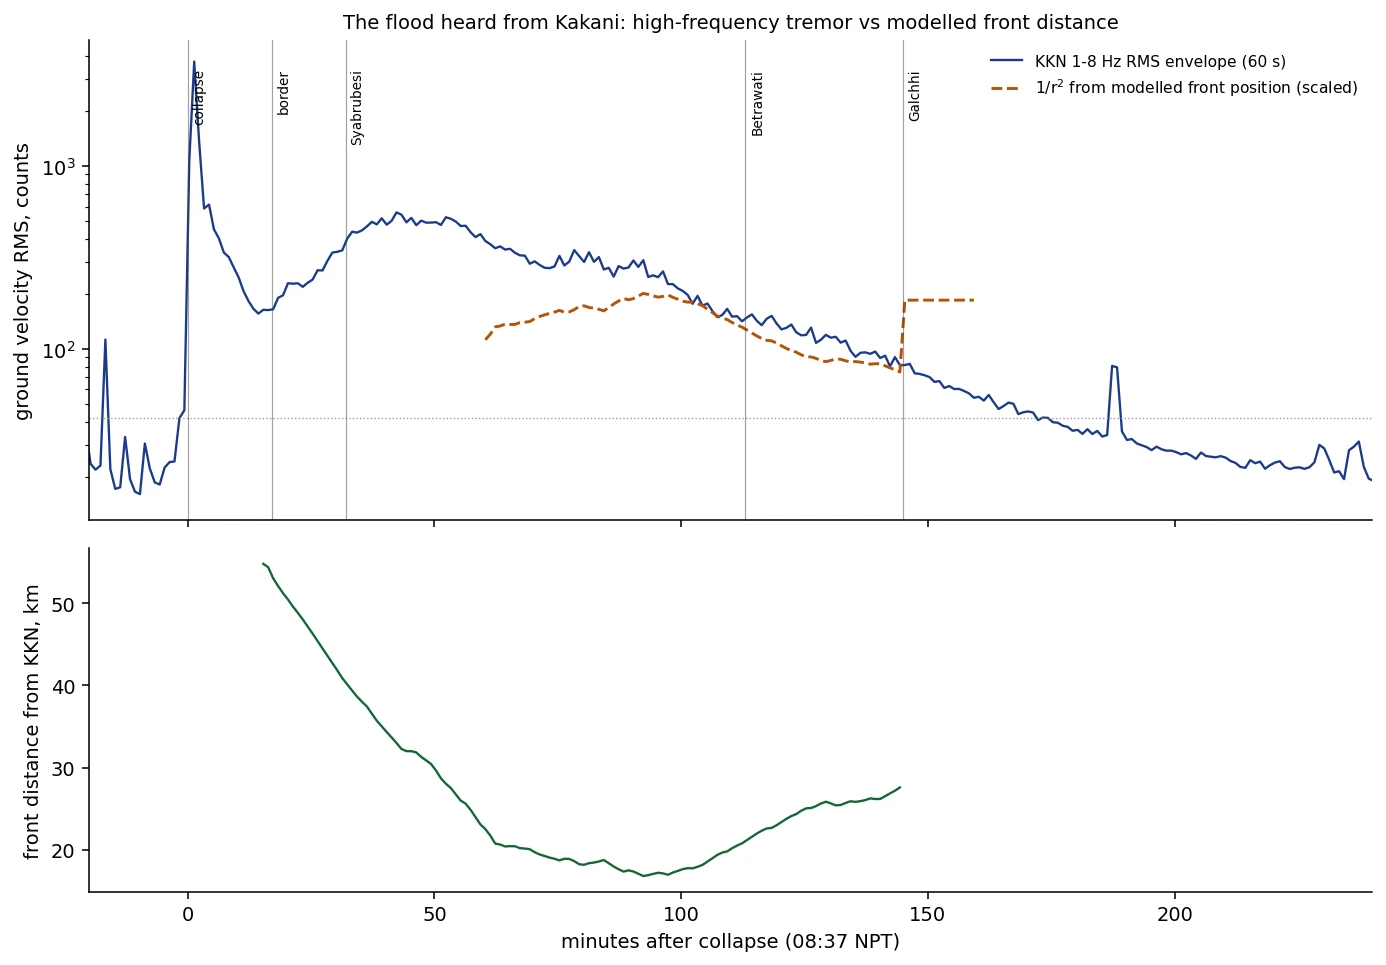
The first signal needs little introduction. At 08:37 local time the envelope leaps to ninety times the pre-event background: the glacier collapse, the event that seismic catalogues worldwide logged as a magnitude 5.2 with the unusual annotation “landslide” rather than “earthquake”. Our earlier force-inversion work found five distinct pulses inside that spike, consistent with a staged, domino-style failure rather than a single clean break.
The second signal is the one this post exists for. By twenty minutes after the collapse, the spike’s coda should be fading toward quiet. Instead the envelope climbs again, reaching a broad plateau around forty to sixty-five minutes after collapse at roughly twelve times background, and then decays slowly over about three hours. There is no aftershock sequence that looks like this. This is flow tremor: the sustained, high-frequency grinding of boulders on bedrock as the flood tore through the gorges, radiating enough seismic energy to be measured tens of kilometres away.
Reading the tremor against the timeline
The shape of that plateau is not arbitrary. The lower panel shows the distance from KKN to the flood front as our reconstruction has it: the front starts 55 kilometres away in the upper gorge, sweeps down the corridor, and passes its closest approach, about 17 kilometres, around the time it reached the Galchhi reach. The tremor rises as the flood approaches and gains power in the steepest reaches, peaks while the flow is both strong and near, and dies away as the flood attenuates on the lower river even though it remains close.
We want to be careful about what we claim here. With one good near-field station, we cannot triangulate the flood’s position from seismic data alone, the way a dense network allowed for the 2021 Chamoli disaster in India. But a simple test holds up better than we expected: scale the vibration by the inverse square of the distance from the station to the modelled front, and the prediction tracks the measured envelope through the whole transit window with a log-space correlation of 0.87. A single moving source at the reconstructed position explains most of what the station heard. What the record provides, then, is an independent clock and a plausibility check on the flood’s power. The vibration rises, peaks, and decays exactly when a flood following our reconstructed timeline should make it do so, and that timeline was built entirely from satellites, terrain, and hydraulics, with no seismic input after the initial collapse time.
There is one more feature we cannot yet explain: a short, discrete burst at about three hours and eight minutes after the collapse, well after the main tremor has faded. An aftershock of the collapse zone, a secondary bank failure, a slump into the new channel. We flag it as an open question, and the interferometric radar monitoring now running on the valley may eventually answer it.
Why this matters beyond one flood
Everything in this post came from a single open station and an afternoon of analysis. Nepal’s mountain valleys, like most of the Himalaya, have far more seismometers than river gauges, and the gauges are precisely the instruments a flood destroys first. The Bhote Koshi’s gauges went offline at 08:40, three minutes after the collapse. The seismometer at Kakani never stopped recording.
A station that hears a collapse spike followed by a rising tremor plateau is describing a specific, dangerous thing with tens of minutes of lead time for downstream communities. That is not a new idea in the research literature, and operational systems exist for individual instrumented catchments. But the Bhote Koshi record is a clean, public, textbook example of the signature, on an unmonitored river, from an open station. If it helps make the case for listening to mountain rivers through the ground they shake, it will have earned its place in this series.
For anyone who wants the data: station KKN, network NK, channel BHZ, 26 August 2026, 02:30 to 07:30 UTC, via any EarthScope FDSN client. The processing is a bandpass and an envelope, nothing exotic. The rest of the series, including the terrain measurements the timeline rests on, is here.