Could the Bhote Koshi Collapse Have Been Predicted?
We tested every satellite method that has ever forecast an ice-rock avalanche against the 26 August 2026 Nepal collapse. The answer matters for how the Himalaya is monitored.
Summary
- After reconstructing the 26 August flood, we asked the question every disaster leaves behind: could anyone have seen it coming?
- We tested all four satellite precursor channels that have ever forecast an ice-rock avalanche: surface motion, radar coherence, elevation change, and thermal preconditioning.
- The mass that killed at least 289 people moved less than two metres in the hundred days before it fell, with no acceleration up to two days before failure.
- Every warning channel returned a null or a saturated signal. This collapse belonged to a class that does not telegraph.
- That is not a counsel of despair. It redirects the investment: away from forecasting individual slopes, toward screening whole ranges and fixing the downstream warning chain, where hours of usable lead time already existed and went unused.
The reconstruction post told the story of what happened. This one is about whether it had to happen by surprise, and we should say up front that we went looking hoping to find a missed warning. A missed warning would mean the next one can be caught. What we found is harder to act on, and more important to say honestly.
What prediction would take
There is a respectable scientific tradition of forecasting slope collapses, and it rests on one empirical gift: most big failures announce themselves. A rock mass that is about to let go usually creeps first, slowly, then faster, and the speedup follows a pattern regular enough that you can plot the inverse of velocity against time, fit a line, and read off the date where it hits zero. That date is the failure. The method has called mine-wall collapses to within days.
The two most famous Himalayan-adjacent glacier disasters both followed the script. The Aru twin collapses in Tibet in 2016 and the Chamoli disaster in India in 2021 were each preceded by months to years of visible motion, metres upon metres of it, sitting unnoticed in freely available satellite archives. The retrospective papers made an uncomfortable point: the data to raise an alarm existed, and nobody was looking.
So the honest test for 26 August is simple to state. Was this collapse Aru-like, telegraphing its intent to anyone who looked? We had already located the detachment zone with radar change detection, seismic force direction, and offset tracking, all agreeing on a patch of chronically active ice at about 5,800 metres. That gave us the exact pixels to interrogate.
The motion test
Between May and the collapse, Sentinel-2 caught the source zone cloud-free on eight days, the last of them on 24 August, two days before failure. Monsoon cloud is merciless over this range, but 5,800 metres pokes above a lot of weather.
We measured the ice mass’s motion between every usable pair of those images with sub-pixel image correlation, tied to the surrounding bedrock so that satellite geolocation wobble cancels out. One trap is worth recording for anyone repeating this: comparing images from different orbits produces phantom shifts of several metres over steep terrain, because orthorectification errors depend on viewing angle. Same-orbit pairs only. Once we did it properly, the answer was stark.
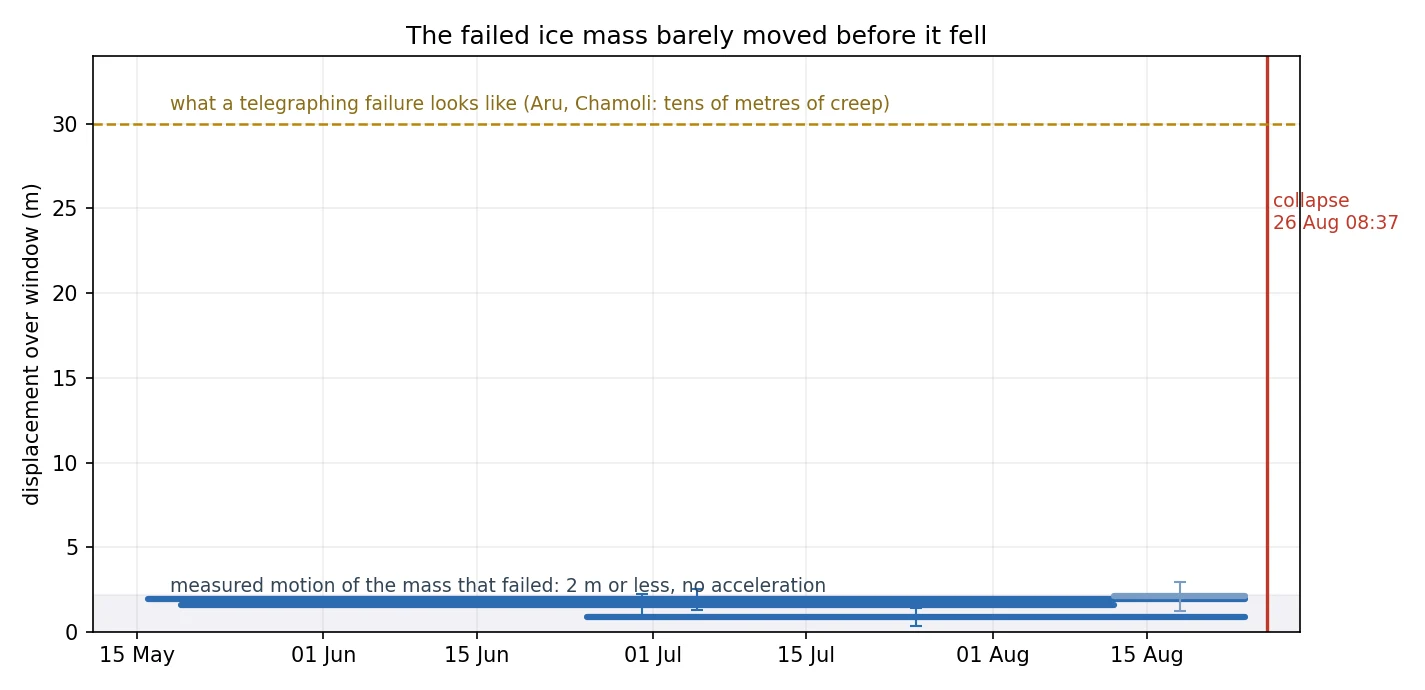
Under two metres of total movement in a hundred days. Around two centimetres a day, constant, with no acceleration in any window we could form, including the final one ending 48 hours before collapse. For comparison, the masses at Aru and Chamoli crawled tens of metres before they went. The inverse-velocity method needs a velocity curve that bends upward. This one was a flat line until it simply ended.
We cross-checked with radar. NASA and ISRO’s new NISAR satellite, in one of the luckier coincidences of this event, had imaged the source repeatedly through July and August, and its urgent-response products span the collapse itself. The radar told us two things. First, the detachment zone is chronically active: its surface churns fast enough that radar coherence there is saturated at zero in every 12 to 24 day interval we examined, all the way back to early July. You cannot watch for the onset of instability at a site that is permanently unstable at your measurement cadence. Second, radar amplitude tracking on this icefall carries a noise floor near ten metres, so it cannot tighten the optical bound; it simply agrees that nothing dramatic moved.
The other channels
Elevation: ICESat-2’s laser happened to cross the detachment zone on a repeating track, with near-identical passes in January 2024 and December 2025. Sixteen matched footprints, four metres apart on the ground, show 1.3 metres of thinning over two years. That is ordinary glacier ablation, not a mass loading up to fail.
Weather: reanalysis data at the failure elevation shows 2026 was a warm season, 44 days above freezing between mid-June and the collapse, with monsoon rain falling on thawed ice for eight straight weeks. Water working into a fractured ice-rock mass is the standard trigger mechanism, and the seismic record’s five-pulse, staged failure fits a mass coming apart wet. But here is the problem with calling that a warning sign:
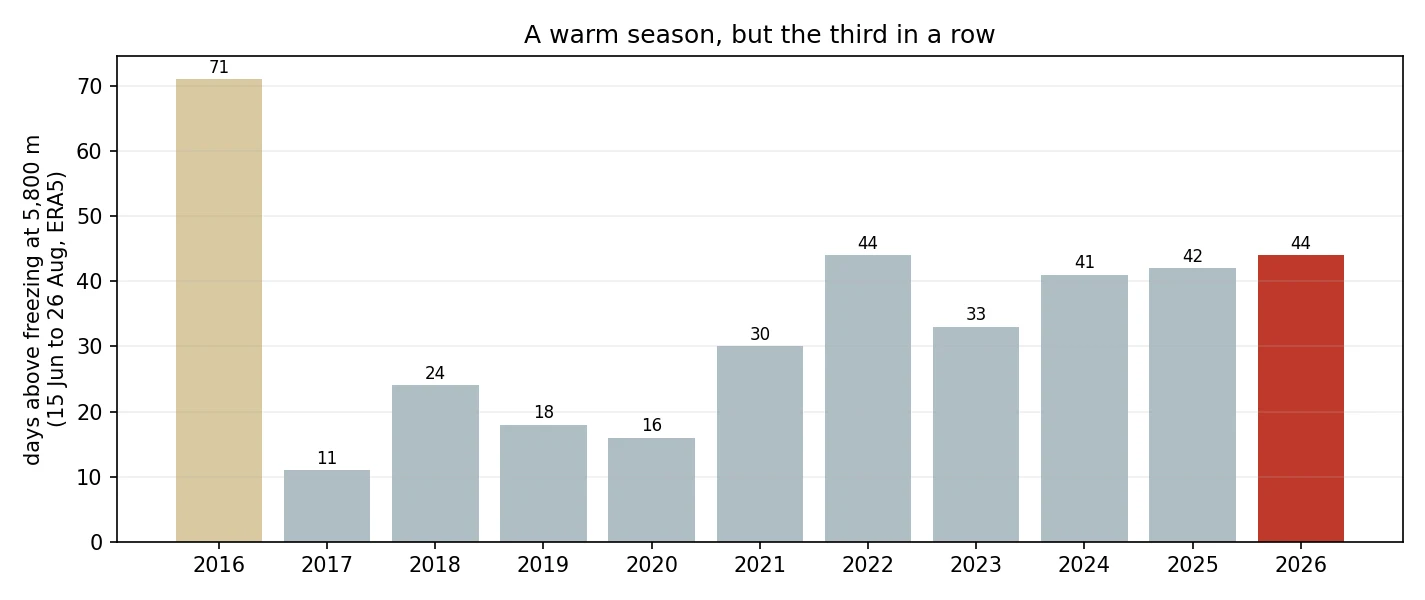
The two previous summers were one and two thaw-days short of identical, and nothing fell. Thermal preconditioning flags the era, and it flags a widening set of Himalayan summers every year. It cannot flag the slope or the week.
What this means for the Himalaya
It would be easy to read this as fatalism. It is the opposite. A negative result this clean tells you where the effort actually pays, and that is in two places.
The first is screening rather than forecasting. We could not have predicted the day, but the site itself was findable in advance. It sits in radar data as a patch of chronic, violent surface activity, hanging at the top of a steep couloir, above a river, above villages, in a catchment that had already produced a disaster fourteen months earlier. NISAR’s open L-band data now makes it possible to map every such chronically active ice mass across the entire Himalaya, seasonally, at modest compute cost. That produces a shortlist: not “this slope will fail on Thursday” but “these two hundred couloirs are the ones that can do this, and these thirty have people under them.” Prevention budgets, sensor deployments and land-use decisions can work with a list like that.
The second is the warning chain, and this is where the arithmetic turns brutal. The collapse was detected within minutes; it registered on the global seismic network as its own magnitude 5.2 event. The wave reached the border in 17 minutes, which no siren system can honestly promise to beat. But most of the people who died were far downstream, where the same wave took two to five hours to arrive. Galchhi had 145 minutes. The Chitwan reaches had more. Those hours existed physically. They were lost institutionally, in the gap between a seismometer knowing and a riverbank knowing, a gap widened when the river gauges were destroyed by the very wave they were meant to report. An automated link from seismic detection to downstream sirens is boring, proven technology. On 26 August it was worth more than every satellite in this story combined.
Data and methods
The displacement series is built from Copernicus Sentinel-2 imagery, the radar analysis from NISAR provisional and urgent-response products (an extraordinary release by the NISAR team, weeks after commissioning), the elevation check from ICESat-2 ATL06, and the climate series from ERA5. All are free and open. Our measurements, the co-registered and analysis-ready intermediate data, and the full reconstruction that this study builds on are in the project repository and the data archive from the first post, under the same open terms. Sub-pixel correlation results are sensitive to orbit geometry and co-registration choices, as described above; we would genuinely welcome independent replication, and the chips to do it with are in the archive.
Casualty figures are those reported by Nepal Police and remain provisional.
Frequently asked questions
Could the 2026 Bhote Koshi glacier collapse have been predicted?
Based on our analysis of four independent satellite precursor channels, very likely not with current methods. The failed ice mass moved less than 2 metres in the 100 days before collapse, with no acceleration up to two days before failure, unlike previous forecastable events such as Aru (2016) and Chamoli (2021), which crept tens of metres before failing.
What usually warns of an ice-rock avalanche?
Most large slope failures accelerate before they fail. Satellite image correlation or radar interferometry can measure that creep, and inverse-velocity analysis can then estimate a failure date. The method works when failures telegraph. The 2026 Bhote Koshi collapse did not.
Was climate change a factor?
The 2026 melt season was the joint warmest of the past decade at the failure elevation, with eight weeks of sustained thaw and rain before the collapse, which fits the standard trigger mechanism for ice-rock failures. But the two previous summers were nearly as warm without a disaster, so warmth alone could not have identified the timing. Warming raises the base rate of these events across the whole range.
What would actually reduce deaths from events like this?
Two things our analysis supports: range-wide screening for chronically active ice masses above settlements, now feasible with open NISAR radar data, and automated links from seismic detection to downstream sirens. Most victims on 26 August were hours downstream of the collapse; the detection existed within minutes, the warning never arrived.