Parallax: A Step Change in Satellite Elevation Models
Parallax is Geopera's new stereo engine. Against airborne LiDAR it gets building edges right 6.3 times as often as the classical matcher it replaces.
Parallax is the stereo engine now behind Geopera’s elevation models. On the IARPA benchmark, scored against airborne LiDAR, it puts 47% of the surveyed ground within half a metre of the truth against 32% for the classical matcher it replaces, and it gets building edges right 6.3 times as often.
Above: the same three images of a processing plant in Kimberley turned into two height models, first with the classical matcher in NASA Ames Stereo Pipeline, then with Parallax, shown at true relief. Kimberley, Northern Cape · 22 Sep 2026 · 30 cm · Processed by Geopera.
6.3×
Building edges in the right place
−41%
Median height error
121/121
Benchmark pairs won against every open-source pipeline
2.2×
Faster matching
Summary
- Parallax replaces one step of the open-source NASA Ames Stereo Pipeline: the dense matching between two images. Camera alignment, triangulation and gridding are unchanged. The matcher is a neural network trained on real satellite stereo pairs labelled from airborne LiDAR.
- On the IARPA MVS3D benchmark (123 WorldView-3 pairs over San Fernando, Argentina, none of them used in training), Parallax puts 46.8% of the LiDAR footprint within 0.5 m, against 32.1% for the pipeline’s classical matcher and 33.8% for S2P-HD.
- Building edges land in the right place far more often: 24.6% boundary F1 for 1 m height steps, against 3.9% for the classical matcher.
- On a satellite it never trained on, at a wide 46° viewing angle over Los Angeles, building error fell by a third against airborne LiDAR.
What changes when the matcher learns
A satellite stereo pair is two images of the same ground taken seconds apart from one orbital pass, from two different angles. A rooftop shifts between the two images by an amount set by its height. Measure that shift at every pixel and you have an elevation model. Everything hard about the problem sits in that measurement: flat roofs with no texture, rows of identical sheds, shadows that change shape with the viewing angle, and ground that one image sees and the other does not.
For about two decades the standard answer has been a hand-designed matcher: compare small image patches, then smooth the result along many directions so that neighbouring pixels agree. NASA Ames Stereo Pipeline, the open-source toolkit NASA built for planetary and Earth imagery, ships several of these. They work well on textured ground and tend to round off the rest. Roof edges become slopes, and narrow gaps fill in.
Parallax keeps the rest of NASA Ames Stereo Pipeline and swaps that one step for a neural network that has learned what the shift looks like on real satellite imagery. Pick a site below and drag across it. Each pair is made from the same images on the same 0.5 m grid.
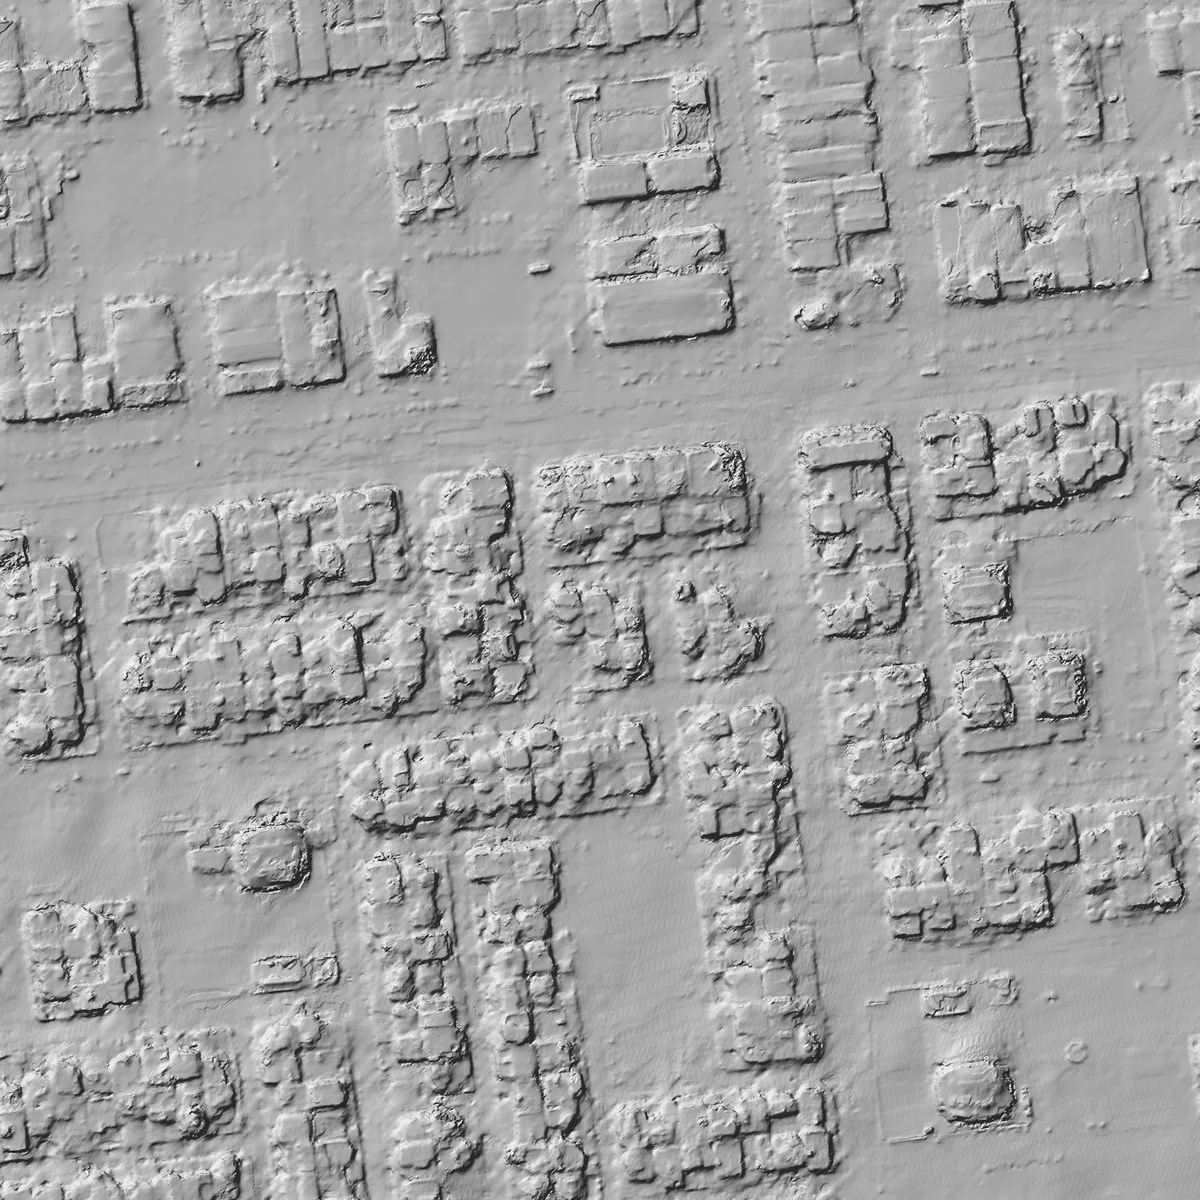
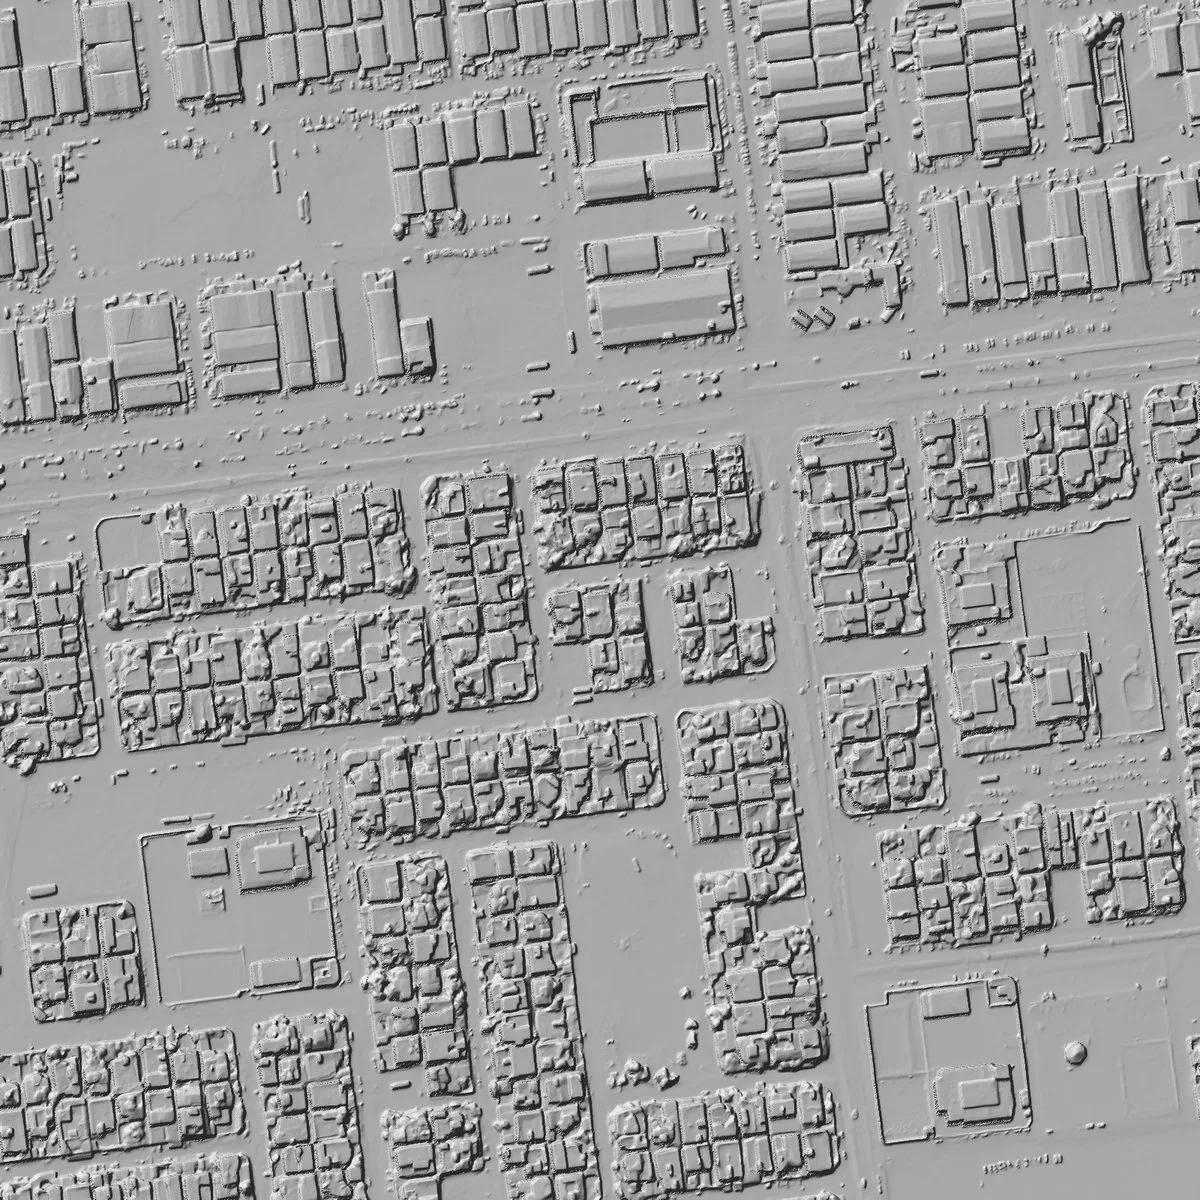
Boundary walls, small objects along the streets and the gaps between houses appear only in Parallax. 800 m across.
Measured against airborne LiDAR, 47% of the footprint lands within half a metre
Pictures persuade, so we tested on a benchmark where the answer is known. The IARPA Multi-View Stereo 3D Mapping challenge, run by Johns Hopkins APL, released WorldView-3 panchromatic imagery over San Fernando, near Buenos Aires, with airborne LiDAR of the same ground at 30 cm. We ran 123 same-pass pairs from its eight areas through five pipelines: Parallax, the classical matcher in NASA Ames Stereo Pipeline (its MGM option), S2P, S2P-HD and CARS. None of this imagery was used to train Parallax.
The scoring rules are strict. Every elevation model is gridded at 0.5 m and placed on the LiDAR with the benchmark’s own registration, so the test measures the shape of the surface, not where the satellite’s camera model put it.3 A cell with no height counts as wrong, and each of the eight areas carries equal weight, so the largest areas cannot dominate.
The lead holds at every tolerance: within 0.3 m Parallax measures 36.0% of the footprint against 22.8% for the classical matcher, and within 1 m 61.0% against 47.4%. On the challenge’s own scorer, Parallax beat every other pipeline on every one of 121 pairs at the 0.5 m threshold.1 Its average gain over the classical matcher is 15.0 points of the footprint (95% interval 14.4 to 15.7), and even its smallest gain on a single pair is 6.6 points. Its median height error is 41% lower: 0.42 m against 0.72 m.
| Pipeline | Footprint filled | Within 0.5 m | Median error | RMS error | Edge F1 |
|---|---|---|---|---|---|
| Parallax | 96.6% | 48.1% | 0.42 m | 2.74 m | 24.6% |
| S2P-HD | 71.4% | 34.8% | 0.61 m | 3.20 m | 7.8% |
| S2P | 71.2% | 34.7% | 0.61 m | 3.19 m | 9.8% |
| NASA Ames Stereo Pipeline (MGM) | 94.8% | 33.0% | 0.72 m | 3.38 m | 3.9% |
Results over 121 benchmark pairs.1 Median and RMS error come from the challenge’s own scorer, averaged over pairs. Edge F1 is the share of 1 m LiDAR height steps a pipeline reproduces within one 0.3 m cell. San Fernando, Buenos Aires · 2014 to 2016 · 30 cm WorldView-3 · IARPA MVS3D LiDAR.
Most of the gain is at edges, where classical matchers smooth
Height errors in a city are not spread evenly. They pile up where the surface jumps: roof edges, walls, the gap between a shed and its neighbour. A classical matcher smooths across those jumps because its smoothing cannot tell a wall from noise. On the benchmark, Parallax reproduces 24.6% of the LiDAR’s 1 m height steps within a single 0.3 m cell, against 3.9% for the classical matcher in NASA Ames Stereo Pipeline. That is 6.3 times as many. Allowed two cells, it reproduces 35.9% against 5.9%.
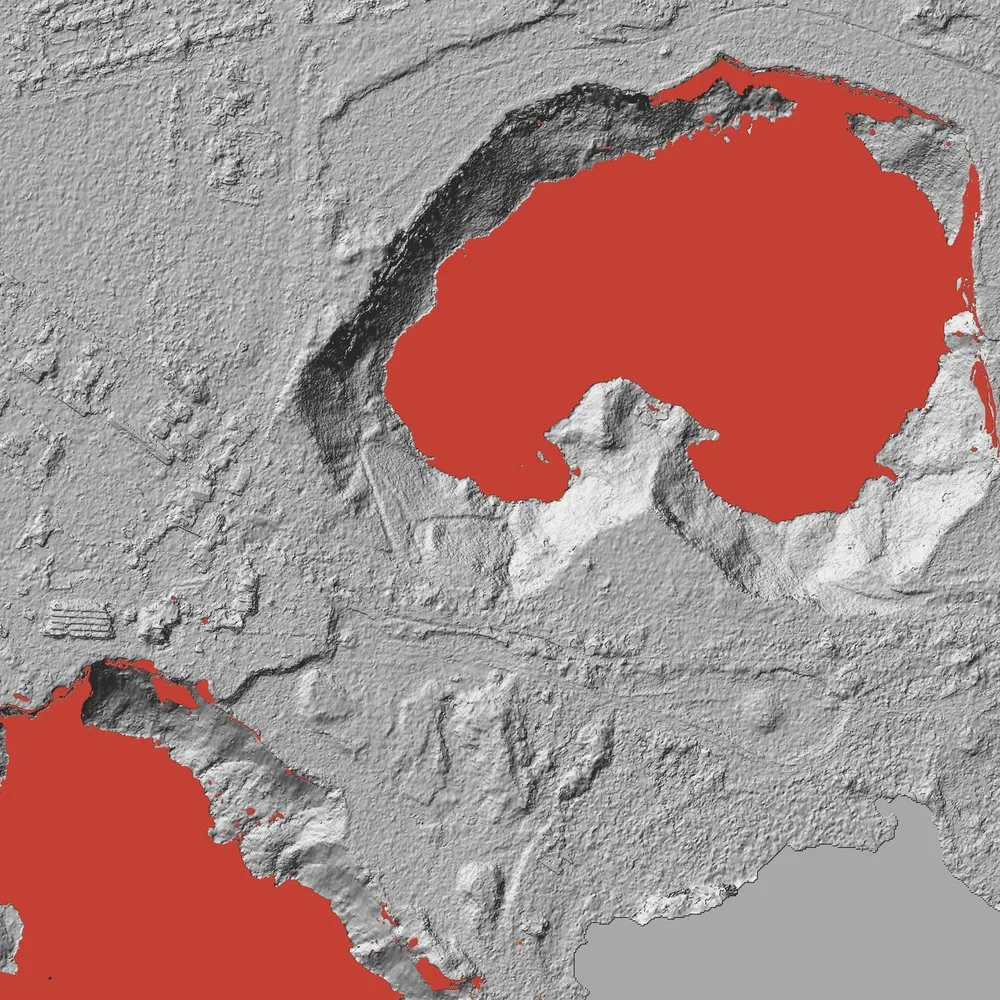
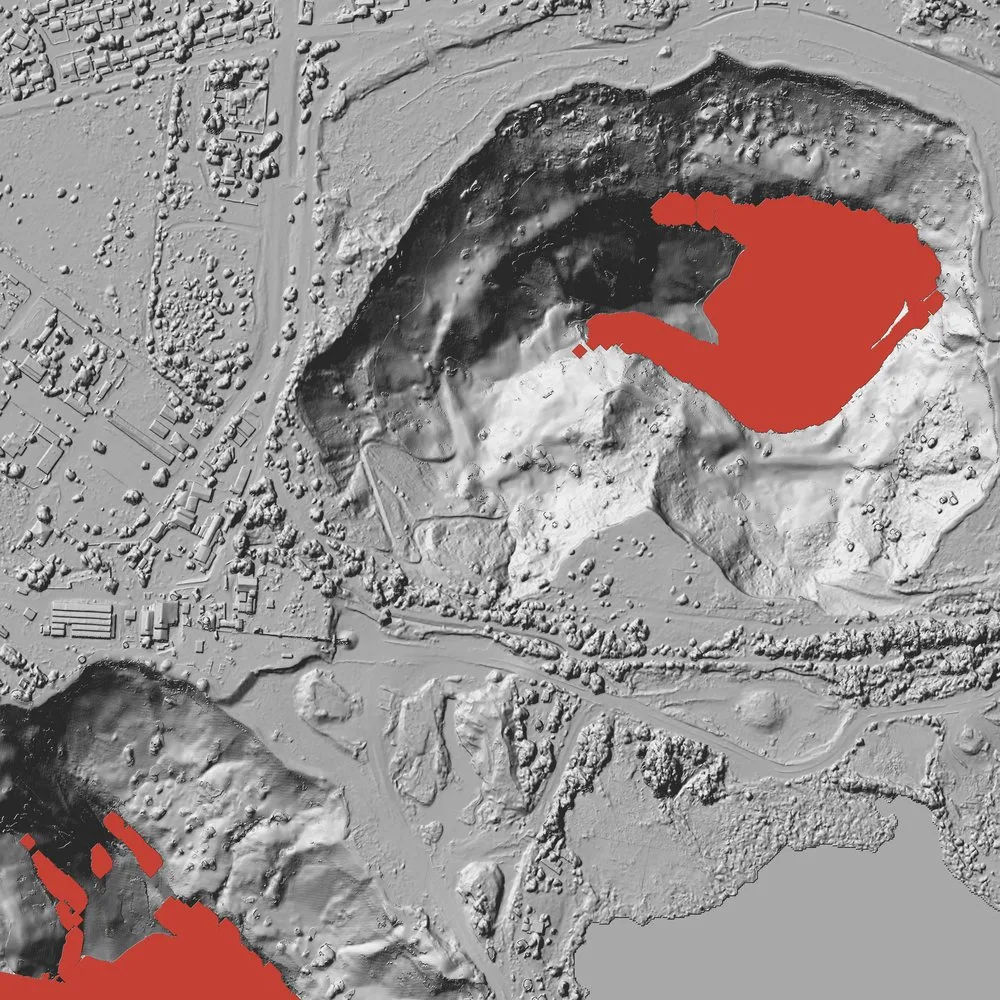
Holes are the other place classical matchers give up. In an open pit the shadowed walls defeat patch comparison, and the classical matcher leaves whole slopes without a height. Of the cells the classical matcher leaves empty on the benchmark, Parallax returns a height for 80.6%, and 23.8% of all those cells come out within 0.5 m of the LiDAR. That is ground the classical pipeline does not measure at all.
On a satellite it never trained on, building error fell by a third
A benchmark from one city and one satellite can flatter a model. So we also scored Parallax on a pair it had no head start on: WorldView Legion imagery of Pacific Palisades, Los Angeles. Parallax never trained on Legion, and the two images look at the ground from 46° apart, a wide angle for stereo. The truth is USGS 3DEP airborne LiDAR, and the comparison is with the network Parallax was fine-tuned from, on identical cells.
| Surface | Starting network | Parallax | Change |
|---|---|---|---|
| Whole scene | 2.45 m | 1.97 m | −20% |
| Ground | 1.05 m | 0.95 m | −10% |
| Buildings | 2.89 m | 1.89 m | −35% |
| Trees | 5.51 m | 4.31 m | −22% |
Mean absolute error against airborne LiDAR on identical cells. Pacific Palisades, Los Angeles · one WorldView Legion pair, 46° between views · USGS 3DEP LiDAR.
What Parallax learned from real satellite pairs carried over to a new satellite and a wide viewing angle. Whole-scene error fell by a fifth and building error by a third, and ground and trees improved too.
Technical details
Pipeline
NASA Ames Stereo Pipeline bundle-adjusts the cameras and aligns each pair to epipolar geometry. Parallax computes disparity at the imagery’s native resolution, tile by tile, and NASA Ames Stereo Pipeline triangulates and grids the points to a 0.5 m elevation model. Parallax runs on one stereo pair or a tri-stereo set from a single pass. It has been run on WorldView-3, WorldView Legion, Gaofen-7 and Beijing-3N imagery from 30 to 80 cm.
Model and training
Parallax is a large stereo network trained first on synthetic scenes and then on 2,055 real satellite stereo pairs whose labels come from airborne LiDAR. Every number in this post comes from the same production checkpoint.
Speed
On one NVIDIA L4 GPU, the matching step took a median of 83 s per benchmark pair, against 180 s for the classical matcher on the same machine.2
Notes
- Over 121 of the benchmark’s 123 pairs. Two pairs over the park area from one January 2016 pass did not produce a usable Parallax model and are left out of these figures. The first bar chart counts all 123.
- Median time the matching step adds per benchmark pair. Stages both pipelines share are not counted.
- Each elevation model is placed on the LiDAR with the benchmark’s own registration before scoring. Parallax’s points were gridded with NASA Ames Stereo Pipeline’s median filter; the other pipelines used the gridding tool’s default.