Red Edge in Remote Sensing: Applications and Advantages
Discover how Red Edge bands revolutionize vegetation monitoring through advanced remote sensing techniques for agriculture, forestry, and environmental applications.
Summary: Red Edge Remote Sensing
Red edge refers to the 680-750nm wavelength region between red and near-infrared light where vegetation reflectance changes dramatically. This spectral region is valuable because:
- It’s highly sensitive to chlorophyll content, making it excellent for detecting plant stress and health
- It can detect vegetation problems 1-2 weeks earlier than traditional methods (before visible symptoms appear)
- It overcomes limitations of NDVI, which saturates in dense vegetation
- It’s especially useful for precision agriculture (nutrient management, yield prediction) and forestry (early stress detection)
- It improves vegetation species classification accuracy across diverse landscapes
Modern satellites like Worldview-3 & Legion include dedicated red edge bands, making this technology widely accessible for agriculture, forestry, and environmental monitoring applications.
Understanding Red Edge Remote Sensing: Applications and Advantages
Remote sensing techniques capture the reflectance of surfaces across different portions of the electromagnetic spectrum. For vegetated areas, this reflectance varies based on plant species, health, and moisture content. By analyzing how this reflectance relates to vegetation properties, we can extract valuable information about plant characteristics from remotely sensed data. Red edge remote sensing, in particular, has opened up exciting opportunities for gaining deeper insights into vegetation health and structure.
What Is the Red Edge Band?
The red edge band is the specific portion of the electromagnetic spectrum that lies between the red and near-infrared bands without overlapping either. This spectral region typically spans wavelengths from 680 to 750 nanometers, though the exact range can vary depending on vegetation species and conditions.
What makes the red edge so distinctive is the sharp increase in reflectance of green vegetation that occurs at this transition from red to near-infrared wavelengths. This dramatic change creates a “edge” in spectral reflectance curves that gives this region its name.
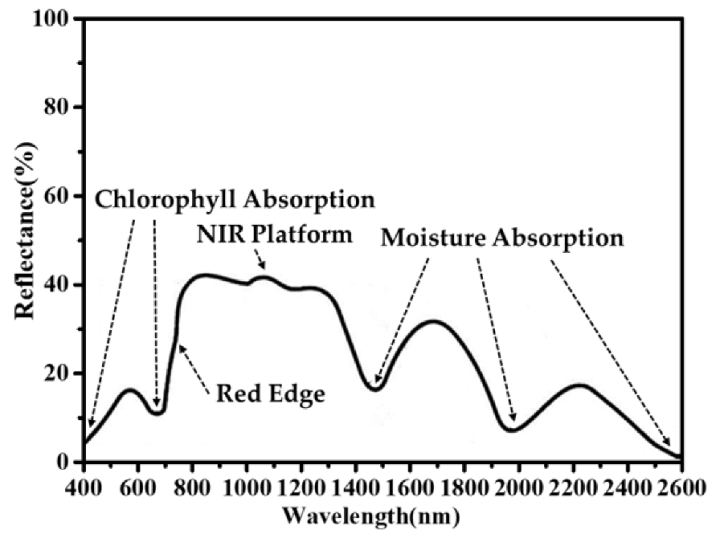 Approximate reflectance spectrum of green plants showing the distinct red edge transition. (Source: Ai, S.; Zheng, H.; Yu, J. Materials 2020, 13, 1540)
What Causes the Shift in Vegetation Reflectance in the Red Edge?
The red edge phenomenon occurs due to two key physiological factors:
- Chlorophyll absorption: The leaves of healthy vegetation contain chlorophyll, which strongly absorbs red light for photosynthesis
- Leaf structure reflectance: The internal cellular structure of leaves scatters near-infrared light, causing strong reflection
This transition from strong absorption of red light to high reflectance of near-infrared light results in the steep change in reflectance that defines the red edge bands in vegetation remote sensing.
Factors Affecting Red Edge Position
Several biophysical factors influence the shape and position of the red edge:
- Chlorophyll concentration
- Internal leaf structure
- Canopy architecture
- Leaf area index (LAI)
- Biomass volume
- Water content
These factors cause the red edge position to shift in measurable ways. Variations closer to the red wavelengths primarily relate to chlorophyll content, while variations nearer to the near-infrared wavelengths connect to leaf structural properties.
Chlorophyll and Water Content Effects
Increases in chlorophyll and/or water content in leaves cause the red edge to shift toward longer wavelengths. Conversely, decreases in chlorophyll and water content—often resulting from stress or senescence—lead to shifts toward shorter wavelengths. This relationship makes red edge remote sensing particularly valuable for detecting plant stress before visual symptoms appear.
Red Edge vs. Traditional Red and Near-Infrared Bands
What makes the red edge band different from standard red and near-infrared bands used in conventional vegetation monitoring?
While strong chlorophyll absorption causes low red reflectance and internal leaf scattering creates strong near-infrared reflectance, the red edge—positioned between these regions—captures nuanced variations in both chlorophyll content and leaf structure simultaneously. This provides more comprehensive information about vegetation status.
The red edge reflectance demonstrates significantly higher sensitivity to chlorophyll a and b concentrations and subtle changes in overall chlorophyll content. This enhanced sensitivity enables earlier detection of plant stress conditions before they become visible to the human eye.
Red Edge-Based Vegetation Indices
Vegetation indices combine two or more spectral bands into a single value to enhance sensitivity to specific vegetation traits. Indices that incorporate red edge bands have proven to significantly improve the detection of certain vegetation attributes from remote sensing data.
These red edge indices address important limitations of traditional vegetation indices like NDVI that use only red and near-infrared bands. In dense vegetation conditions, NDVI reaches a saturation threshold where it becomes insensitive to further changes in chlorophyll content. Consequently, NDVI becomes less effective at estimating important characteristics like biomass, leaf area index, and nutrient status in dense canopies.
Red edge-based vegetation indices maintain sensitivity across a wider range of vegetation densities, making them superior for many advanced monitoring applications.
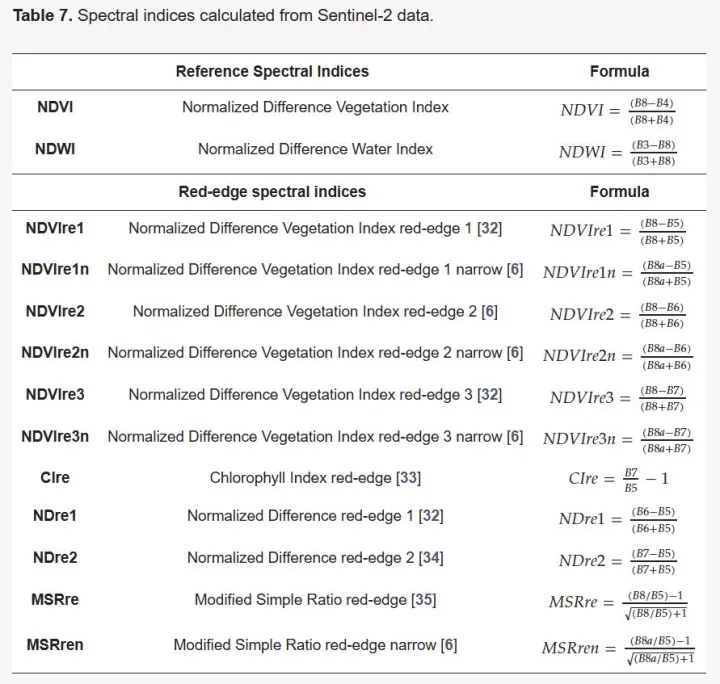 Examples of red edge spectral indices derived from Sentinel-2 imagery. (Source: Sun, L.; Chen, J.; Guo, S.; et al. Remote Sens. 2020, 12, 158)
Applications of Red Edge Remote Sensing
The red edge spectral region provides valuable insights for numerous applications across agriculture, forestry, water quality assessment, and land use/land cover mapping. Let’s explore some key applications:
Monitoring Forest Health and Disturbance
Early detection of forest stress and disturbance is crucial for timely intervention and protection. Stressors—including water deficiency, waterlogging, nutrient depletion, and disease—disrupt vegetation growth, functioning, and productivity. Meanwhile, disturbances like windstorms, wildfires, and disease outbreaks can dramatically alter affected areas.
Since vegetation stress cannot be directly determined visually, an indicator is needed. Chlorophyll content serves as an effective proxy for plant health and stress levels. Stressed plants typically contain lower chlorophyll concentrations than unstressed plants, resulting in higher reflectance in the red region and lower reflectance in the near-infrared region.
Red edge remote sensing excels at detecting these subtle chlorophyll changes. Studies have shown that satellite-based vegetation indices incorporating red edge bands can detect stressed forest stands 13 to 16 days earlier than indices using only red, green, blue, and near-infrared bands. This earlier detection window is possible because the red edge region responds more sensitively to changes in chlorophyll a and b than traditional red and green spectral regions.
For forest disturbance classification, red edge-based vegetation indices achieve better results at classifying the magnitude of forest disturbance in complex environments like spruce-dominated mountainous areas compared to traditional indices like NDVI.
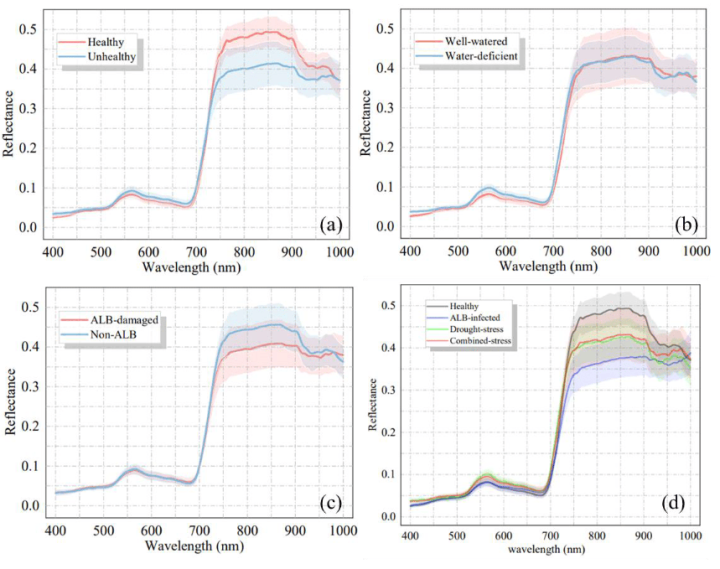 Mean spectral reflectance of poplars grouped by stress type, extracted from UAV-hyperspectral imagery. (Source: Zhou, Q.; Kuang, J.; Yu, L.; et al. Remote Sens. 2024, 16, 3751)
Precision Agriculture Applications
Precision agriculture aims to optimize yields while efficiently using inputs and reducing environmental impacts. Monitoring crop conditions is essential for early issue detection and implementing site-specific management solutions. Red edge remote sensing contributes significantly to these efforts in several ways:
Crop health detection: The sensitivity of red edge bands to chlorophyll content makes them excellent indicators of overall crop health.
Nutrient status assessment: Since chlorophyll concentration correlates with nitrogen supply, red edge bands and derived indices help understand spatial variability in crop nutrient status, informing variable-rate fertilizer application strategies.
Growth monitoring and yield prediction: Red edge indices are less affected by canopy density than traditional indices, providing more accurate estimates of key growth parameters like leaf area index (LAI) and chlorophyll content.
Studies have identified the red edge region among the most crucial variables for estimating chlorophyll content in crops like maize across various growth stages. This information helps farmers assess crop responses to management practices and environmental conditions, enabling field-specific optimization.
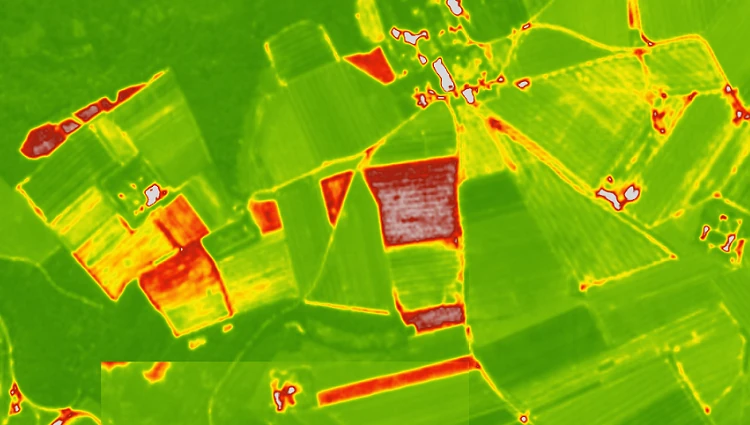
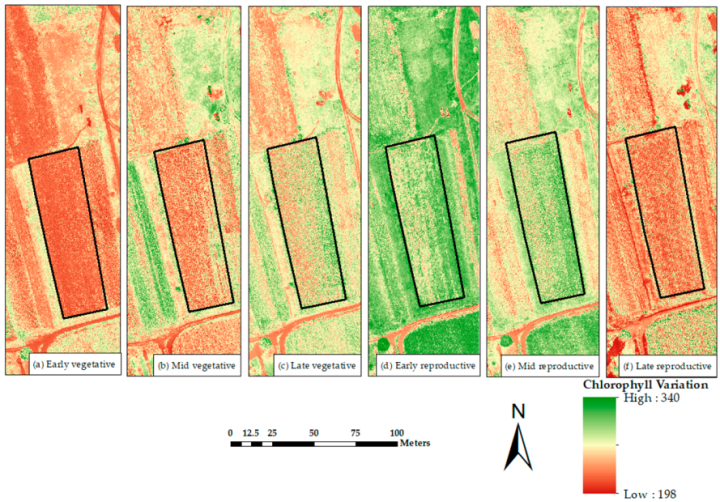 Spatial distribution of chlorophyll content across a maize field during vegetative growth stages. (Source: Brewer, K.; Clulow, A.; Sibanda, M.; et al. Remote Sens. 2022, 14, 518)
When using red edge bands and derived indices to inform management decisions, it’s important to consider the multiple factors affecting plant growth and health, including soil conditions, topography, hydrology, and other environmental variables. Knowledge of the primary growth-limiting factors in specific fields helps link observed reflectance variability to appropriate management inputs.
Classifying Vegetation Species
Vegetation classification is essential for environmental monitoring, decision-making, and resource planning. The red edge wavelengths offer unique advantages for distinguishing between different vegetation types due to their sensitivity to species-specific attributes like leaf and canopy structure, chlorophyll content, and leaf area index.
The subtle differences in how various plant species reflect electromagnetic radiation in the red edge region can be leveraged for accurate classification. The shift in red edge position often serves as a distinctive signature for differentiating vegetation species.
Red edge remote sensing has proven valuable for classification across diverse contexts and landscapes:
- Crop type mapping: Sentinel-2 red edge bands significantly improve distinction between different crop classes
- Wetland classification: Red edge and near-infrared bands increase separability between wetland vegetation types
- Forest-dominated landscapes: In boreal landscapes, a quarter of the most important classification variables belong to the red edge band
- Grass species discrimination: Sentinel-2 red edge band 5 has been identified as the most influential for distinguishing between different grass species
Vegetation classification accuracy can be further enhanced by considering phenology—the seasonal changes in plant characteristics that affect reflectance patterns. Understanding species-specific relationships between red edge reflectance and biophysical attributes like chlorophyll content and canopy structure can inform optimal timing and methods for species separation.
The Red Edge Advantage
The red edge region offers several distinct advantages over traditional spectral bands for vegetation monitoring:
- Higher sensitivity to vegetation characteristics like chlorophyll content and leaf structure
- More nuanced insights into vegetation status, including health, type, structure, and nutrient conditions
- Earlier stress detection before visible symptoms appear, enabling timely interventions in agriculture and forestry
- Enhanced discrimination between vegetation types, improving mapping accuracy in heterogeneous landscapes
- Broader application range across different vegetation densities where traditional indices saturate
Red edge remote sensing can be implemented across multiple platforms and scales. Satellite-based measurements enable large-scale, long-term monitoring of vegetation dynamics at regional scales. Hyperspectral imagery provides detailed insights at local scales, while ground-based measurements offer high-resolution data to complement and validate satellite and airborne observations.
Conclusion
Red edge remote sensing represents a significant advancement in our ability to monitor and understand vegetation. By capturing the unique spectral transition between red and near-infrared wavelengths, the red edge band provides more sensitive and nuanced information about plant health, structure, and composition than traditional spectral regions alone.
From precision agriculture to forest health monitoring and species classification, red edge-based approaches consistently demonstrate superior performance for critical vegetation assessment tasks. As remote sensing technologies continue to evolve, the red edge advantage will likely play an increasingly important role in environmental monitoring, resource management, and sustainable development practices worldwide.
Whether you’re a researcher, environmental manager, agricultural consultant, or forest steward, incorporating red edge bands into your remote sensing toolkit can provide deeper insights and earlier detection capabilities for more effective vegetation management.