Instant NDVI in Browser, Capture Notifications, and More Updates to the Pera Portal
Discover the latest Pera Portal enhancements: Sentinel-2 integration, 28 browser-based indices, multi-provider samples, comparison tools, and smart alerts for satellite imagery analysis.
New Pera Portal Features for 2025
Satellite imagery analysis workflows have increasingly moved to browser-based platforms, reducing the need for specialised desktop software and local processing power. We’ve released five new features for the Pera Portal that expand analysis capabilities while maintaining the platform’s focus on accessibility and ease of use.
These updates include Sentinel-2 data integration, browser-based spectral index calculations, multi-provider data samples, comparison tools, and automated alert functionality for new imagery acquisitions.
1. Sentinel-2 Data Integration
The European Space Agency’s Sentinel-2 mission provides free, high-quality satellite imagery with global coverage every five days. This dataset is now integrated into the Pera Portal, allowing users to search and visualise Sentinel-2 data alongside commercial imagery within the same interface.
What makes this integration special:
- Search and visualise Sentinel-2 data directly alongside commercial imagery
- 10-meter resolution multispectral data perfect for large-scale monitoring projects
- 5-day revisit cycle enabling detailed change detection and temporal analysis
- 13 spectral bands including crucial vegetation red-edge channels
- Seamless data fusion with commercial providers for comprehensive analysis
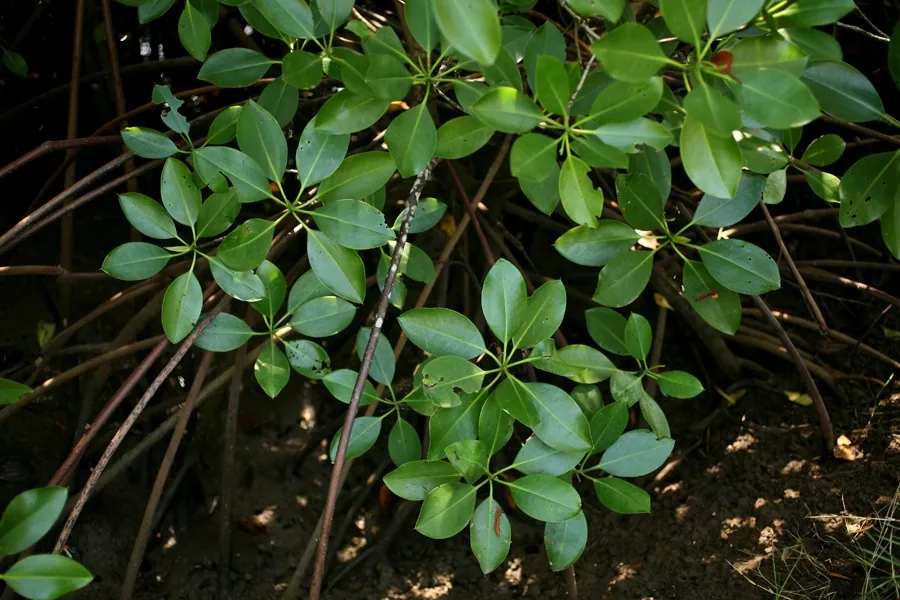
This integration is useful for environmental monitoring and agricultural applications where Sentinel-2’s 5-day revisit frequency and red-edge spectral bands support vegetation health tracking and crop development monitoring. The dataset provides baseline coverage for environmental impact assessment and compliance monitoring, while commercial imagery can be used for higher resolution analysis of specific areas.
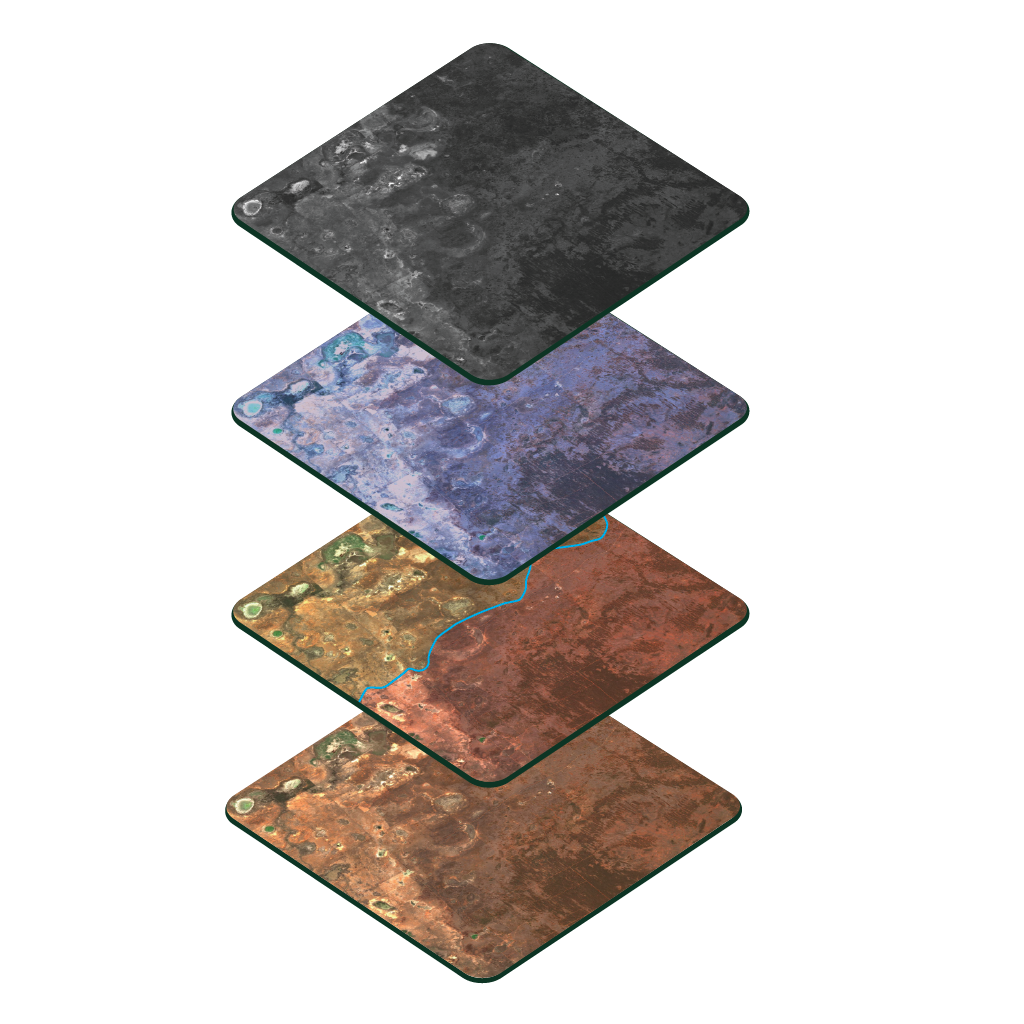
2. Browser-Based Spectral Index Calculations
The portal now includes 25+ pre-configured visualizations and spectral indices for Sentinel-2 data, covering RGB composites and specialised analysis indices. These are calculated in the browser without requiring data downloads or additional software installations.
RGB Composite Visualizations:
- Natural Colour (Red, Green, Blue)
- Colour Infrared (NIR, Red, Green)
- Agriculture (SWIR1, NIR, Blue)
- Forestry Coverage (Red, NIR, Blue)
- False Colour Urban (SWIR2, SWIR1, Red)
- Land/Water (NIR, SWIR1, Red)
- Healthy Vegetation (NIR, SWIR1, Blue)
Vegetation Indices:
- NDVI (Normalized Difference Vegetation Index)
- NDRE (Normalized Difference Red Edge)
- EVI (Enhanced Vegetation Index)
- SAVI (Soil-Adjusted Vegetation Index)
- MSAVI2 (Modified Soil-Adjusted Vegetation Index v2)
- ARVI (Atmospherically Resistant Vegetation Index)
- Red Edge NDVI
- Chlorophyll Red Edge Index
- SIPI (Structure Insensitive Pigment Index)
Water and Environmental Indices:
- NDWI (Normalized Difference Water Index)
- NDWI with SWIR
- NDSI (Normalized Difference Snow Index)
- NBR (Normalized Burn Ratio)
Specialised Analysis:
- Deforestation Index
- Fire Detection Index
- Scene Classification Layer
Previously, calculating these indices required downloading imagery and setting up local processing environments. The browser-based approach enables faster iteration and immediate visual feedback when comparing different indices. Users can select an area of interest, choose an index, and view results without data downloads.
For agricultural applications, this allows rapid comparison of different indices to identify the most suitable approach for specific crops and growth stages. Environmental monitoring workflows benefit from the ability to quickly switch between vegetation health, water stress, and soil condition indicators.
For a deeper understanding of how these indices work and when to use each one, check out our comprehensive guide to remote sensing vegetation indices.
3. Multi-Provider Sample Data
The portal now includes sample datasets from four commercial providers: Wyvern, 21AT, CGST, and Spacewill. These samples allow users to evaluate different sensor capabilities and data quality before making procurement decisions.
What’s available:
- Pre-processed sample datasets covering diverse landscapes and applications
- Applied spectral indices showing real-world analysis examples
- Quality comparison tools to evaluate resolution, spectral characteristics, and processing quality
- Use case demonstrations tailored to specific industries
This feature supports project planning and vendor selection. Users can compare hyperspectral capabilities for mineral identification, evaluate different sensors for crop monitoring, and assess temporal resolution and spectral bands for specific monitoring requirements.
The samples include diverse geographic regions and applications:
- Agricultural sites showing crop health monitoring capabilities
- Mining areas demonstrating geological and environmental applications
- Forest regions highlighting deforestation and biodiversity monitoring
- Urban areas showcasing infrastructure and development tracking
- Water bodies illustrating flood monitoring and water quality assessment
Each sample comes with metadata about acquisition parameters, processing methods, and suggested applications, giving you the information needed to make informed decisions about data procurement for your projects.
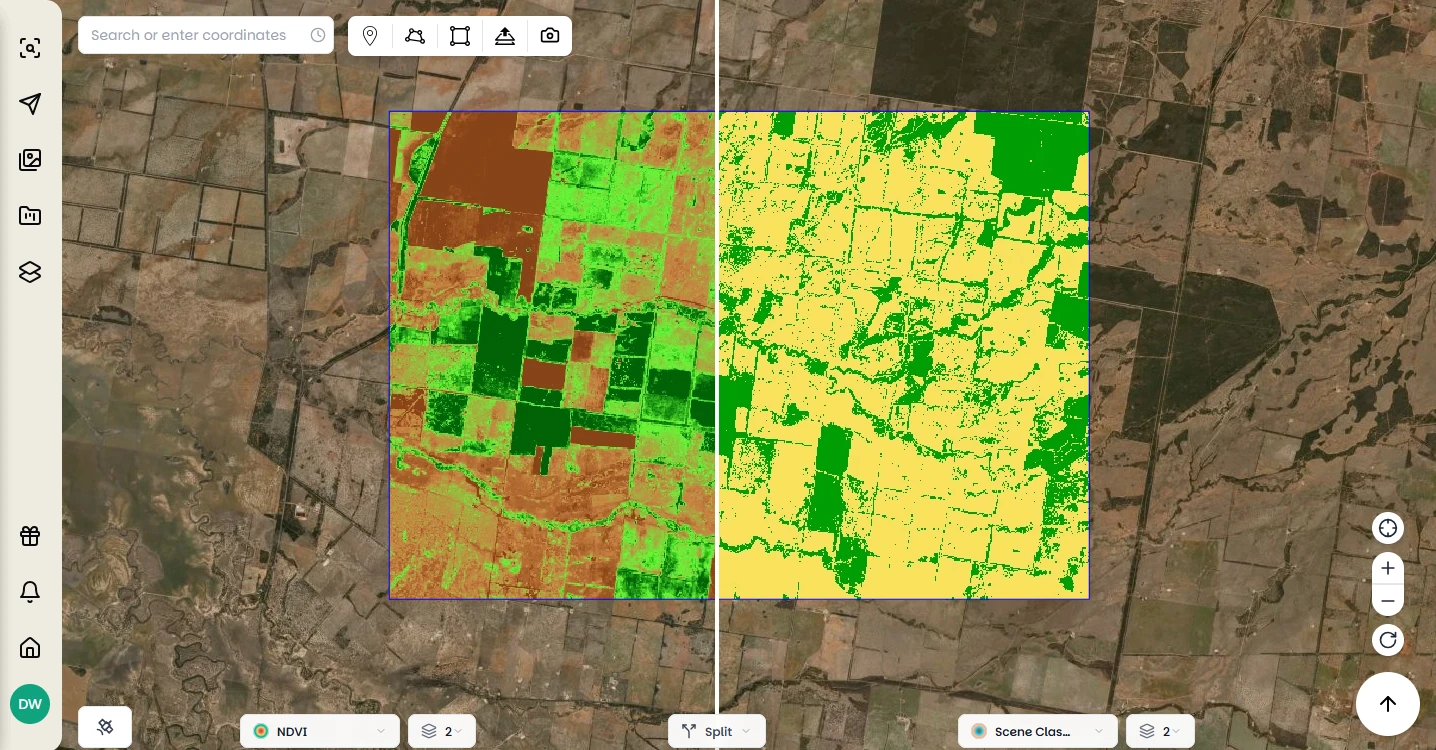
4. Comparison Tools
The portal includes new tools for side-by-side imagery comparison, supporting temporal analysis, multi-sensor evaluation, and processing method assessment.
The Comparison Slider: Perfect for temporal analysis, this tool enables precise before-and-after comparisons. The implementation allows pixel-perfect alignment for change detection applications, making it ideal for:
- Environmental impact assessment (pre and post-mining, construction, or natural disasters)
- Agricultural monitoring (seasonal crop development, harvest timing, irrigation effectiveness)
- Urban development tracking (infrastructure growth, land use changes)
- Disaster response (flood extent mapping, fire damage assessment, recovery monitoring)
Mirror View: The split-screen comparison tool enables simultaneous viewing of different datasets, spectral bands, or processing methods. This is particularly powerful for:
- Multi-sensor fusion (comparing commercial high-resolution with Sentinel-2)
- Spectral analysis (side-by-side viewing of different vegetation indices)
- Quality assessment (comparing different processing methods or data providers)
- Workflow optimization (testing different analysis approaches simultaneously)
The tools maintain spatial accuracy across different zoom levels and projections, supporting professional applications requiring precise alignment.
5. Automated Imagery Alerts
The portal now includes an alert system that notifies users when new imagery becomes available over specified areas of interest. This supports time-sensitive applications requiring rapid access to updated imagery.
How the system works:
- Define areas of interest using our intuitive drawing tools or by uploading shapefiles
- Select commercial providers to monitor (Maxar, Planet, Airbus, and more)
- Set notification preferences (email, portal notifications, or both)
- Customise alert frequency (immediate, daily digest, or weekly summary)
Real-world applications:
- Disaster response preparation: Get immediate alerts when post-event imagery becomes available
- Construction project monitoring: Track progress with regular imagery updates over project sites
- Environmental compliance: Ensure rapid detection of changes in sensitive areas
- Security applications: Monitor critical infrastructure or border regions
- Agricultural management: Time field visits and management decisions with fresh imagery
The system integrates with existing data partnerships, providing notifications for imagery from multiple commercial providers through a single interface. Users can configure immediate email notifications for high-priority applications or daily/weekly digest formats for routine monitoring.
Accessing the Updated Portal
These features are now available in the Pera Portal for environmental monitoring, agricultural analysis, mining exploration, and infrastructure planning applications.
Getting started:
- Existing users can access new features by logging into the Pera Portal
- New users can request access through our contact page
- Enterprise teams can contact our technical team for custom integrations or training
The updated portal provides expanded analysis capabilities while maintaining browser-based accessibility for satellite imagery workflows.
Related Articles
Understanding Remote Sensing Vegetation Indices
A comprehensive guide to NDVI, EVI, SAVI and other vegetation indices used in satellite imagery analysis for monitoring plant health and agricultural productivity.
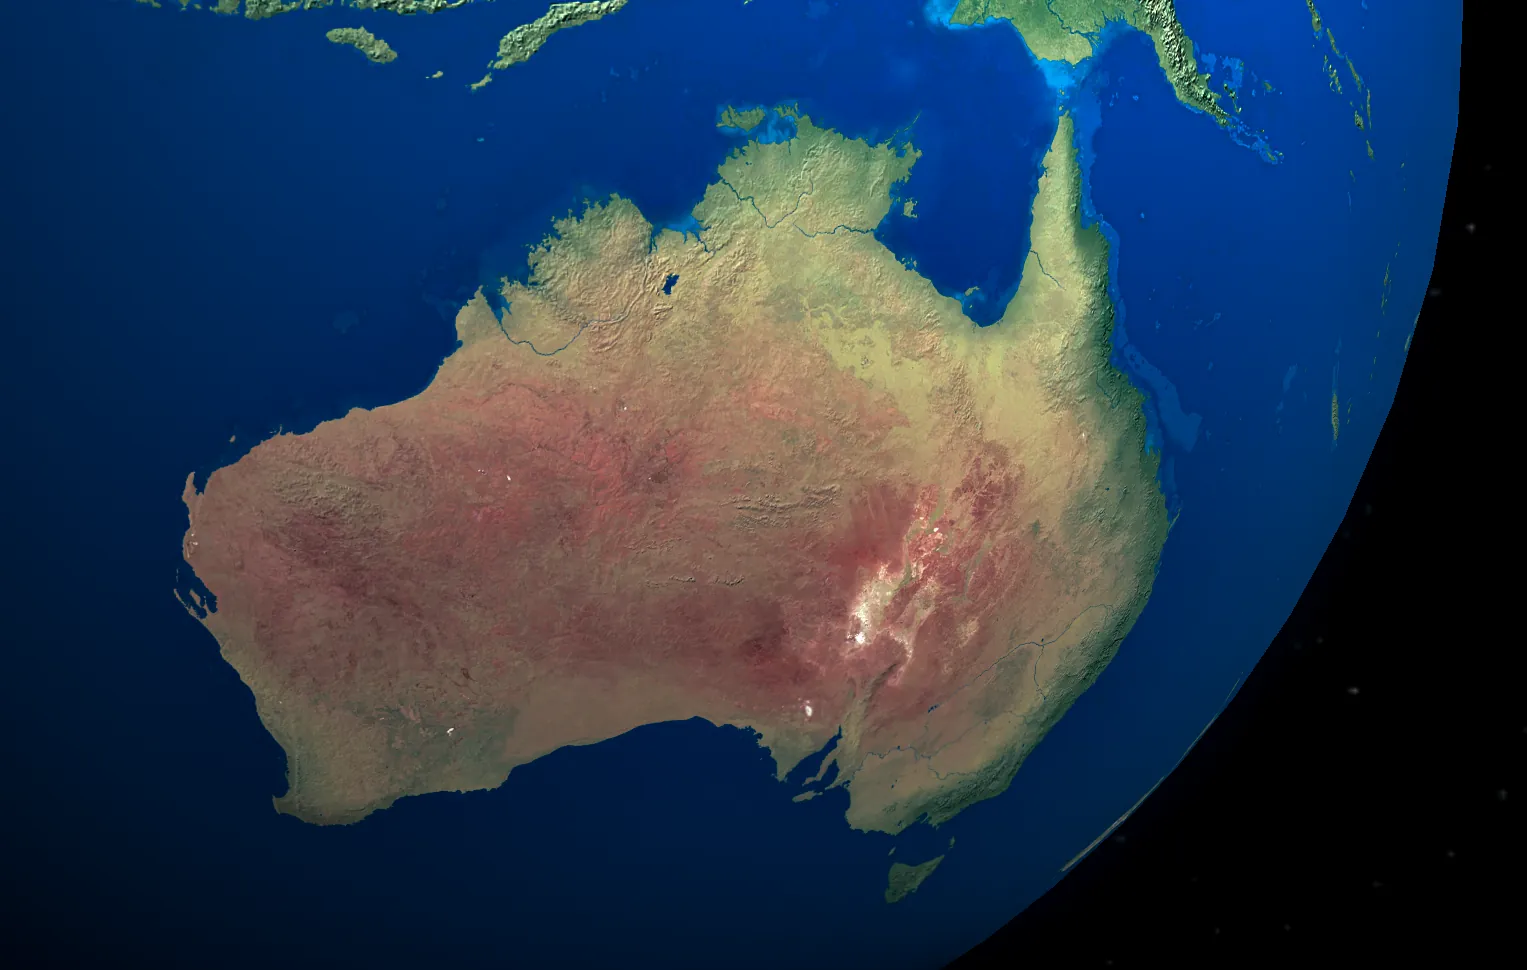
10 Best Free Sources of Satellite Data for Australia
Discover the best free satellite imagery sources available for Australian projects and research.
Google Earth vs Commercial Satellite Imagery
Comprehensive comparison of Google Earth and commercial satellite imagery platforms for professional applications.